- Don’t miss your chance to experience Discovery Summit Europe at our best available rate! Early bird registration through 31 Oct.
- Graph Builder Toolbar streamlines interactive graphing. Creates shortcuts on Report and GraphBuilder Helpers toolbars. Download and install the extension.
- Subscribe to RSS Feed
- Mark Topic as New
- Mark Topic as Read
- Float this Topic for Current User
- Bookmark
- Subscribe
- Mute
- Printer Friendly Page
Discussions
Solve problems, and share tips and tricks with other JMP users.- User Community
- :
- Discussions
- :
- Re: Quantifying how many rows selected

- Mark as New
- Bookmark
- Subscribe
- Mute
- Subscribe to RSS Feed
- Get Direct Link
- Report Inappropriate Content
Quantifying how many rows selected
This has to be possible... Is there an easy way to quantify the number of rows selected (and ideally the percent of rows selected) and display it on a dashboard? I know that I can go back to the raw data table and see the number Selected in the Rows area - I'd like to pull that onto a dashboard...
Specific example - here's gas flow through a panel data. How many cells are highlighted as a fraction of the total?
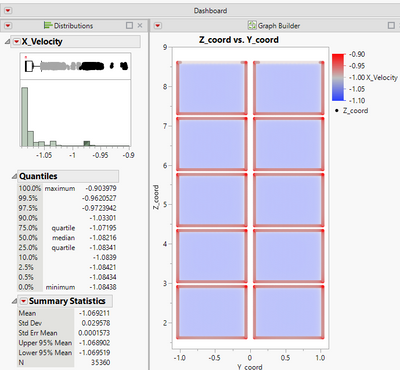
I can go back to the data table and see that it's 2270 rows, so the data's available... I'd just like to put it on the dashboard
Thanks in advance
Charles
Accepted Solutions
- Mark as New
- Bookmark
- Subscribe
- Mute
- Subscribe to RSS Feed
- Get Direct Link
- Report Inappropriate Content
Re: Quantifying how many rows selected
Thanks for that suggestion... I'm being dumb, though... How do I put that on my dashboard as an element that provides the summary statistic there (without having to go back to the data table)


- Mark as New
- Bookmark
- Subscribe
- Mute
- Subscribe to RSS Feed
- Get Direct Link
- Report Inappropriate Content
Re: Quantifying how many rows selected
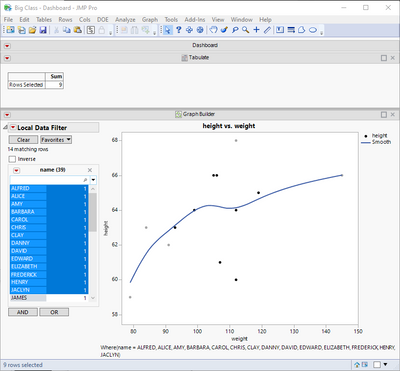
I don't really use Dashboards (I build my own windows) so I don't know if this is the only method.. but I think you can create new element with some platform (Graph Builder, Tabulate comes to my mind) and then add that to the dashboard. Here is very very quick example with Tabulate using the Selected() formula in column called Rows Selected
- Mark as New
- Bookmark
- Subscribe
- Mute
- Subscribe to RSS Feed
- Get Direct Link
- Report Inappropriate Content
Re: Quantifying how many rows selected
One option is to create formula column with following formula to get 1 when column is selected.
Selected()If you only care about total you can then count them from that formula column or possibly use Col Sum directly in the formula
Col Sum(Selected())See Special Formula Columns for more fancy uses for special formula columns like that.
Other option is to use Row State Handler (or Graphic Script) with something like:
N Items(Current data Table() << Get Selected Rows)
- Mark as New
- Bookmark
- Subscribe
- Mute
- Subscribe to RSS Feed
- Get Direct Link
- Report Inappropriate Content
Re: Quantifying how many rows selected
Thanks for that suggestion... I'm being dumb, though... How do I put that on my dashboard as an element that provides the summary statistic there (without having to go back to the data table)
- Mark as New
- Bookmark
- Subscribe
- Mute
- Subscribe to RSS Feed
- Get Direct Link
- Report Inappropriate Content
Re: Quantifying how many rows selected
I don't really use Dashboards (I build my own windows) so I don't know if this is the only method.. but I think you can create new element with some platform (Graph Builder, Tabulate comes to my mind) and then add that to the dashboard. Here is very very quick example with Tabulate using the Selected() formula in column called Rows Selected

- Mark as New
- Bookmark
- Subscribe
- Mute
- Subscribe to RSS Feed
- Get Direct Link
- Report Inappropriate Content
Re: Quantifying how many rows selected
The percent selected would simply be
dt=current data table();
percentSelected = N Items( dt << get selected rows ) / N Rows( dt );Recommended Articles
- © 2026 JMP Statistical Discovery LLC. All Rights Reserved.
- Terms of Use
- Privacy Statement
- Contact Us