- Don’t miss your chance to experience Discovery Summit Europe at our best available rate! Early bird registration through 31 Oct.
- Graph Builder Toolbar streamlines interactive graphing. Creates shortcuts on Report and GraphBuilder Helpers toolbars. Download and install the extension.
- Subscribe to RSS Feed
- Mark Topic as New
- Mark Topic as Read
- Float this Topic for Current User
- Bookmark
- Subscribe
- Mute
- Printer Friendly Page
Discussions
Solve problems, and share tips and tricks with other JMP users.- User Community
- :
- Discussions
- :
- Re: Percent distribution vs percent frequency occurrence

- Mark as New
- Bookmark
- Subscribe
- Mute
- Subscribe to RSS Feed
- Get Direct Link
- Report Inappropriate Content
Percent distribution vs percent frequency occurrence
Hi,
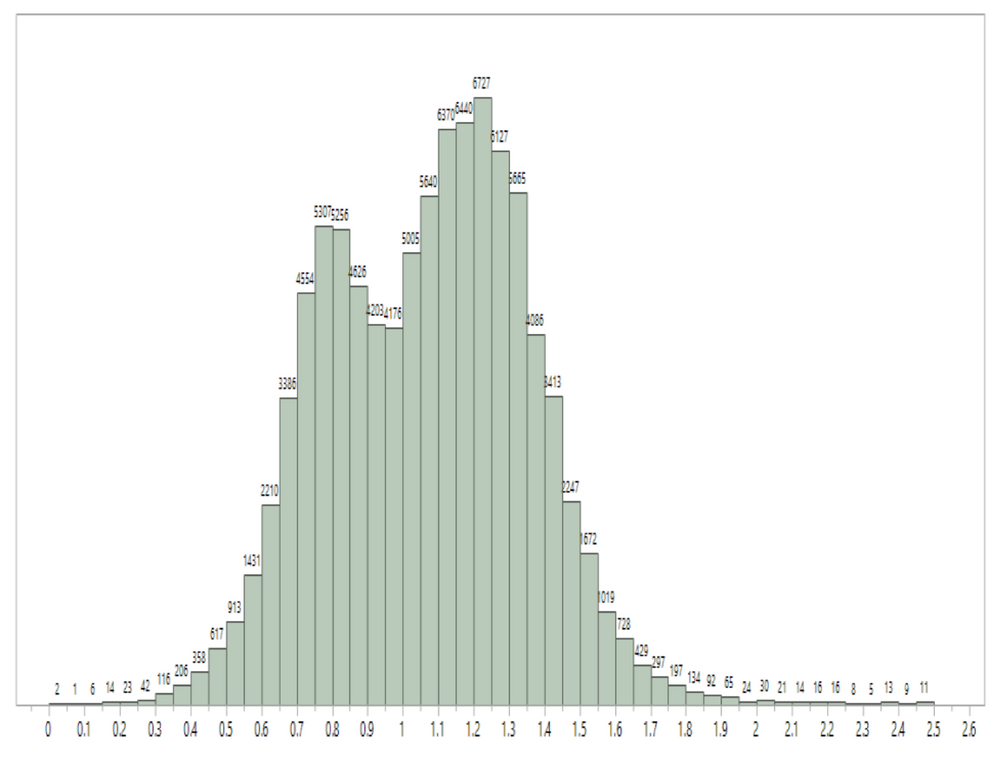
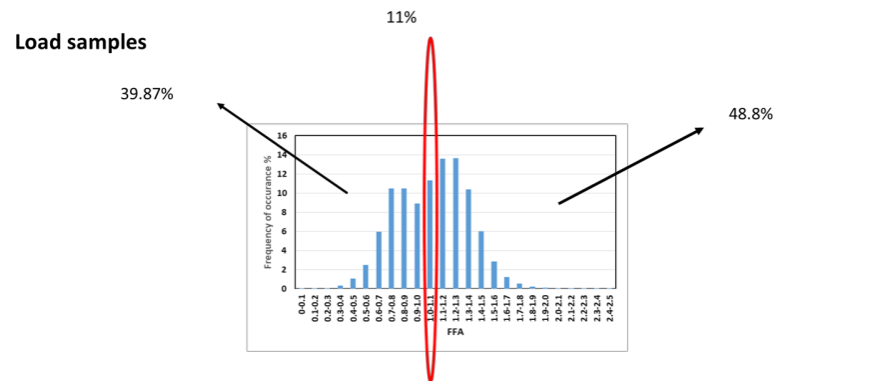
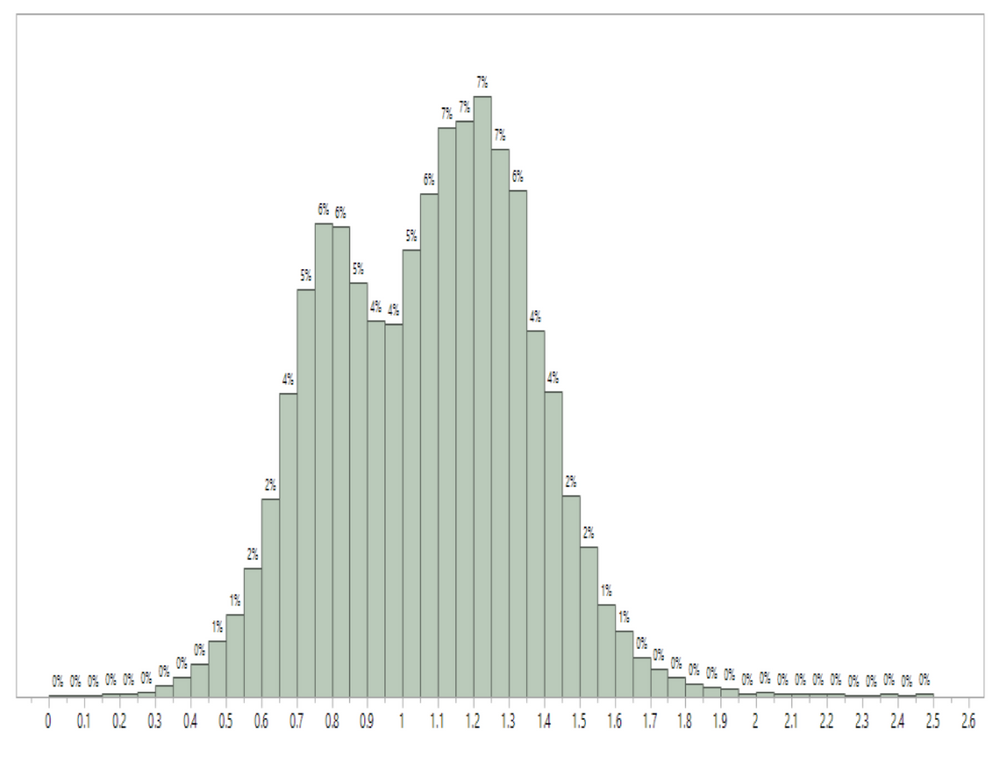
I have distribution graph from jmp with count and percent as encloed. In jmp although the count number is there jmp reads it zero. Therefore, there is a difference between calculated % why is this happening?
thanks
Accepted Solutions


- Mark as New
- Bookmark
- Subscribe
- Mute
- Subscribe to RSS Feed
- Get Direct Link
- Report Inappropriate Content
Re: Percent distribution vs percent frequency occurrence
The JMP display is showing only whole % values....no decimal values. That is, the percents are rounded off to the percent value. Thus, when a percent value is < .5% it is displayed as 0%.
- Mark as New
- Bookmark
- Subscribe
- Mute
- Subscribe to RSS Feed
- Get Direct Link
- Report Inappropriate Content
Re: Percent distribution vs percent frequency occurrence
The JMP display is showing only whole % values....no decimal values. That is, the percents are rounded off to the percent value. Thus, when a percent value is < .5% it is displayed as 0%.
- Mark as New
- Bookmark
- Subscribe
- Mute
- Subscribe to RSS Feed
- Get Direct Link
- Report Inappropriate Content
Re: Percent distribution vs percent frequency occurrence
Thanks for your reply but if this is the case why the peak for percent graph is 7% and for count 11%?


- Mark as New
- Bookmark
- Subscribe
- Mute
- Subscribe to RSS Feed
- Get Direct Link
- Report Inappropriate Content
Re: Percent distribution vs percent frequency occurrence
I must be missing something. In your document, the circled bar is from 1.0 to 1.1 and has a total of 11%.
In the last picture, the JMP graph as a bar from 1.0 to 1.05 with a height of 5% and another bar from 1.05 to 1.1 with a height of 6%. 5% + 6% = 11%. As for the counts, they appear to be 5005+ 5640 = 10645/98968 = 10.756%. That matches with the rounding that Jim described.
The difference that I see is that in one graph you have bars taking a width of 0.1, while in the other the bar width is 0.05.
- Mark as New
- Bookmark
- Subscribe
- Mute
- Subscribe to RSS Feed
- Get Direct Link
- Report Inappropriate Content
Re: Percent distribution vs percent frequency occurrence
Many thanks for the clear explanation. You are right.
Regards
Recommended Articles
- © 2026 JMP Statistical Discovery LLC. All Rights Reserved.
- Terms of Use
- Privacy Statement
- Contact Us