- Subscribe to RSS Feed
- Mark Topic as New
- Mark Topic as Read
- Float this Topic for Current User
- Bookmark
- Subscribe
- Mute
- Printer Friendly Page
Discussions
Solve problems, and share tips and tricks with other JMP users.- JMP User Community
- :
- Discussions
- :
- Re: One way ANOVA comparing means.
- Mark as New
- Bookmark
- Subscribe
- Mute
- Subscribe to RSS Feed
- Get Direct Link
- Report Inappropriate Content
One way ANOVA comparing means.
Is there a way to get JMP to give a t value for each level in a student t test and also q value in a comparison of all pairs using Tukey-Kramer HSD?.
hopefully that isn't to silly of a question.
thanks!
Accepted Solutions
- Mark as New
- Bookmark
- Subscribe
- Mute
- Subscribe to RSS Feed
- Get Direct Link
- Report Inappropriate Content
Re: One way ANOVA comparing means.
As stated above:
Use the Fit Y by X platform. Specify your response and x variable.
Then on the red-traingle menu, select Compare Means > Each Pair, Student's t to do a t test of each pair. Select Compare Means > All Pairs, Tukey HSD to do a Tukey test on each pair. The t values and q values are part of the output. Remember, the t test doesn't correct for multiple comparisons, the Tukey test does. JMP has other multiple comparison procedures on that same menu. JMP 9 has all that plus nonparametric multiple comparisons.
Now that I read your post again, you may be asking about something else. If you are looking for JMP functions that will return quantiles or probabilties, then consider the following functions:
t distribution
t quantile
Tukey HSD Quantile
Tukey HSD P Value
They are found in the formula editor or in JSL.
- Mark as New
- Bookmark
- Subscribe
- Mute
- Subscribe to RSS Feed
- Get Direct Link
- Report Inappropriate Content
Re: One way ANOVA comparing means.
- Mark as New
- Bookmark
- Subscribe
- Mute
- Subscribe to RSS Feed
- Get Direct Link
- Report Inappropriate Content
Re: One way ANOVA comparing means.
As stated above:
Use the Fit Y by X platform. Specify your response and x variable.
Then on the red-traingle menu, select Compare Means > Each Pair, Student's t to do a t test of each pair. Select Compare Means > All Pairs, Tukey HSD to do a Tukey test on each pair. The t values and q values are part of the output. Remember, the t test doesn't correct for multiple comparisons, the Tukey test does. JMP has other multiple comparison procedures on that same menu. JMP 9 has all that plus nonparametric multiple comparisons.
Now that I read your post again, you may be asking about something else. If you are looking for JMP functions that will return quantiles or probabilties, then consider the following functions:
t distribution
t quantile
Tukey HSD Quantile
Tukey HSD P Value
They are found in the formula editor or in JSL.
- Mark as New
- Bookmark
- Subscribe
- Mute
- Subscribe to RSS Feed
- Get Direct Link
- Report Inappropriate Content
Re: One way ANOVA comparing means.
Sorry for resurrecting an old post, but I have a question on your answer.
I can create the fit x by y chart and it creates the graph I'd like. Then I can click the red triangle or right click the graph and add the tukey comparison.
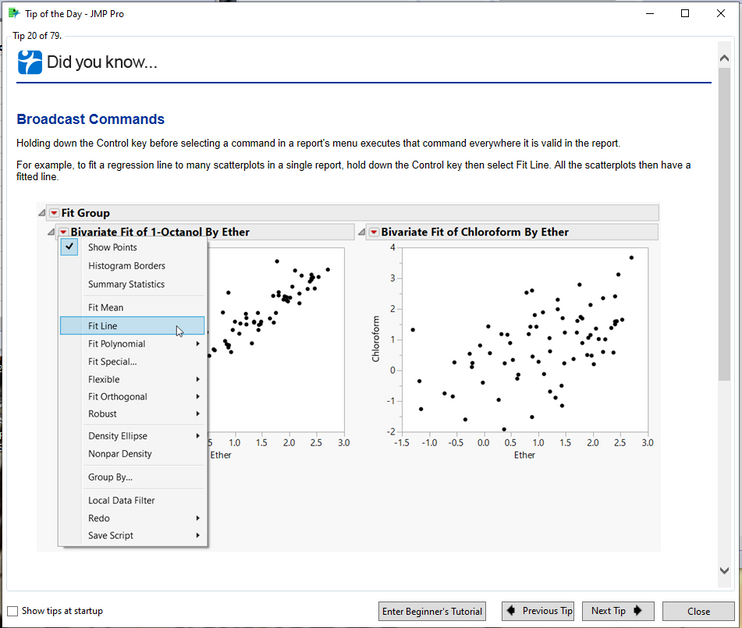
My question is, if I have a hundred+ graphs, is there a way to add the tukey comparison to all the graphs? Or do I need to manually go through and add it to all of them?
Or is there a way to modify all the fit by x test results at once?
- Mark as New
- Bookmark
- Subscribe
- Mute
- Subscribe to RSS Feed
- Get Direct Link
- Report Inappropriate Content
Re: One way ANOVA comparing means.
I suggest that you read through the Tip of the Day, there it covers the ability to Broadcast the options by holding down the CNTL key when you make the Tukey Comparison selection, and it will be broadcast to all of the graphs that were created with Fit Y by X platform
Recommended Articles
- © 2026 JMP Statistical Discovery LLC. All Rights Reserved.
- Terms of Use
- Privacy Statement
- Contact Us


