- Instantly extract effect sizes, F-ratios, and FDR-adjusted p-values from your models with the Calculate Effects Sizes extension, available now in the JMP Marketplace!
- New to JMP? Join us Sept. 23-24 for the Early User Edition of Discovery Summit, tailor-made for new users. Register now for free!
- Your voice matters! Tell us how you prefer to receive JMP updates, so we can tailor our communication to your needs. Take short survey.
- Subscribe to RSS Feed
- Mark Topic as New
- Mark Topic as Read
- Float this Topic for Current User
- Bookmark
- Subscribe
- Mute
- Printer Friendly Page
Discussions
Solve problems, and share tips and tricks with other JMP users.- JMP User Community
- :
- Discussions
- :
- Navigating "rows" of interest in constellation plot

- Mark as New
- Bookmark
- Subscribe
- Mute
- Subscribe to RSS Feed
- Get Direct Link
- Report Inappropriate Content
Navigating "rows" of interest in constellation plot
Hi,
Is there a way to easily find 'rows of interest' in a constellation plot containing thousands of points? My wish would be to highlight a row in my table and easily zoom into it in the constellation plot to see the neighbors, but I can't seem to see a way. Thanks!
Matt
Accepted Solutions

- Mark as New
- Bookmark
- Subscribe
- Mute
- Subscribe to RSS Feed
- Get Direct Link
- Report Inappropriate Content
Re: Navigating "rows" of interest in constellation plot
Here's some starter JSL. (Thanks @txnelson .) It will need some love and care to make it do what you need, but I think it demonstrates the problem and a solution. I'd definitely expect this code to break when JMP has a new major release because it relies on (among other things) the order JMP writes commands to an SVG file, which could change for a number of reasons in the future. (Also after playing with it, I'm not sure it is really what you want, at least not without some more thought about the user interface.)
Edit 1: JSL should run in JMP 15 and 16 now...
Edit 2: attempting to add the try(...)
// *** choose big class or random data, below ***
//
// example JSL for auto-zoom on constellation plot
//
// because the constellation plot uses its own internal coords for the diagram and does
// not expose them, this code may break at any time in the future. Or past. Or now.
// This JSL saves the graph as SVG and attempts to load the SVG as XML and discover
// where the node IDs are plotted. It uses that info to reposition the axes when rows
// are selected. This JSL uses some global flags to decide if the graph is being used
// for row selection, in which case the axis update is delayed so the data does not
// jump around under the selection rectangle. Part of that fix means an extra mouse
// move is required to trigger the redraw. This JSL also uses some features of XML
// import to deal with the SVG pattern. If the SVG writer changes the way it handles
// text or ellipses, it will need rework.

If( 0, // 1 for big class, 0 for big data
    dt = Open( "$sample_data/big class.jmp" );
    dt << Graph Builder( Size( 525, 454 ), Show Control Panel( 0 ), Variables( X( :weight ), Y( :height ) ), Elements( Points( X, Y, Legend( 3 ) ) ) );
    zoom = 10;//<<<<<<<<<<<< adjust for number of nodes
    hc = dt << Hierarchical Cluster(  Y( :height, :weight ),  Color Clusters( 1 ),   Method( "single" ),  Standardize By( "Columns" ),
        Show Dendrogram( 0 ),  Dendrogram Scale( "Distance Scale" ),   Number of Clusters( 5 ),  Constellation Plot( 1 ) );//
,// else make some random data with clusters. 3000 is beginning to lag enough to not be fun, but still usable...
    nObs = 2000;
    dt = New Table( "Untitled",
        New Column( "name", values( 1 :: nObs ) ), // in this table, or bigclass, name is the id
        New Column( "x", Numeric, "Continuous", Format( "Best", 12 ), values( J( nObs, 1, Random normal(random integer(1,3),.25 ) ) )),
        New Column( "y", Numeric, "Continuous", Format( "Best", 12 ), values( J( nObs, 1, Random normal(random integer(1,3),.25 ) ) ) ),
        Set Label Columns( :name )
    );
    dt:name << datatype( "character" );// it needs to match the character data from XML, like bigclass
    dt << Graph Builder( Size( 525, 454 ), Show Control Panel( 0 ), Variables( X( :x ), Y( :y ) ), Elements( Points( X, Y, Legend( 3 ) ) ) );
    zoom = 100;//<<<<<<<<<<<< adjust for number of nodes
    hc = dt << Hierarchical Cluster( Y( :x, :y ),  Color Clusters( 1 ), Method( "FastWard" ),  Standardize By( "Columns" ),
        Show Dendrogram( 0 ), Dendrogram Scale( "Distance Scale" ), Number of Clusters( 9 ),  Constellation Plot( 1 )  );
);

// make an SVG picture of the constellation, name it with an XML extension
CP = Report( hc )[Outline Box( "Constellation Plot" )];
(CP[framebox( 1 )]) << savepicture( "$temp/constellationPlot.svg", "svg" );
try( deletefile("$temp/constellationPlot.svg.xml") );
renamefile("$temp/constellationPlot.svg","constellationPlot.svg.xml");

// open it once to get the constellation coordinates for each row
// this is complicated because one row is at zero degrees and becomes a special case.
// "ellipse" is the marker's center for either case, but text is nested deeper (or not) for
// the two cases, and needs a separate row-maker. By forcing both text fields to be named
// "nodename" they are put in the same column.
// the coords are typically 0..500, see bounding box below.
dtPositions = Open(
    "$TEMP/constellationPlot.svg.xml",
    XML Settings(
        Stack( 1 ),
        Row( "/svg/g/g/g/g/g/g/g" ),
        Row( "/svg/g/g/g/g/g/text" ),
        Col( "/svg/g/g/g/g/g/text", Column Name( "nodename" ), Fill( "Use Once" ), Type( "Character" ) ),
        Col( "/svg/g/g/g/g/g/ellipse/@cx", Column Name( "xx" ), Fill( "+", "/svg/g/g/g/g/g/ellipse/@cx" ), Type( "Numeric" ) ),
        Col( "/svg/g/g/g/g/g/ellipse/@cy", Column Name( "yy" ), Fill( "+", "/svg/g/g/g/g/g/ellipse/@cy" ), Type( "Numeric" ) ),
        // above: ellipse is before text. There are many unlabelled ellipse, the +...@ drops old ones as new ones show up.
        // most recent ellipse center is combined with the text ID for the nodename.
        // either nodename goes in the nodename col; one happens sometimes when a label is horizontal
        // (0 degrees leave out the transform, see alice single-link case).
        Col( "/svg/g/g/g/g/g/g/g/text", Column Name( "nodename" ), Fill( "Use Once" ), Type( "Character" ) )
    ),
    XML Wizard( 0 )// use 1 to reopen wizard if something needs to change for SVG in the future
);

// open it again to get the bounding box coordinates (typ 0..500). They are needed for scaling the data above into 0..1 coords.
dtSize = Open(
    "$temp/constellationPlot.svg.xml",
    XML Settings(
        Stack( 1 ),
        Row( "/svg" ),
        Col( "/svg/g/g/rect/@x", Column Name( "xmin" ), Fill( "Use Once" ), Type( "Numeric" ) ),
        Col( "/svg/g/g/rect/@y", Column Name( "ymin" ), Fill( "Use Once" ), Type( "Numeric" ) ),
        Col( "/svg/g/g/rect/@width", Column Name( "xwide" ), Fill( "Use Once" ), Type( "Numeric" ) ),
        Col( "/svg/g/g/rect/@height", Column Name( "yhigh" ), Fill( "Use Once" ), Type( "Numeric" ) )
    ),
    XML Wizard( 0 )
);

// add the xx and yy cols back into the source table. You probably don't want to save these later. Maybe you'd rather update to the temp file.
dt << Update( With( dtPositions ), Match Columns( :name = :nodename ), Add Columns from Update Table( :xx, :yy ) );
Close( dtPositions, nosave );

// Jim Nelson's code for the row state handler started this...modified a bit. Capture the original axis range.
maxX = CP[axisbox( 2 )] << get Max;
minX = CP[axisbox( 2 )] << get Min;
maxY = CP[axisbox( 1 )] << get Max;
minY = CP[axisbox( 1 )] << get Min;

f = Function( {a}, // this "a" is only the rows that just changed state, sel or unsel
    If( outside, // the mouse is outside of the graph, OK to update the axes
        // for zooming, we need *all* the selected rows to get a bounding box
        a = (dt << getselectedrows);
        If( N Rows( a ) > 0,
            minSelectedX = 99e99;// the loop below captures min and max for x and y
            maxSelectedX = -99e99;
            minSelectedY = 99e99;
            maxSelectedY = -99e99;
            For( i = 1, i <= N Rows( a ), i += 1,
                If( Selected( Row State( dt, a[i] ) ),
                    xxx = (dt:xx[a[i]] - dtsize:xmin[1]) / dtsize:xwide[1]; // SVG 0..500 ->  unit space 0..1
                    yyy = (dt:yy[a[i]] - dtsize:ymin[1]) / dtsize:yhigh[1];
                    // the axis range is typically -10..10, and the 0..500 SVG range has to be mapped back to the axis
                    xxx = minX + xxx * (maxX - minX); // 0..1 -> axis range. This is the Constellation Plot's internal coords
                    yyy = minY + (1 - yyy) * (maxY - minY);
                    minSelectedX = Min( minSelectedX, xxx ); // capture the range of the selected rows
                    maxSelectedX = Max( maxSelectedX, xxx );
                    minSelectedY = Min( minSelectedY, yyy );
                    maxSelectedY = Max( maxSelectedY, yyy );
                )
            );
            If( minSelectedX <= maxSelectedX & minSelectedY <= maxSelectedY, //if we got something captured, zoom in
                z = max( (maxX - minX) / zoom, (maxY - minY) / zoom );
                CP[axisbox( 2 )] << Min( minSelectedX - z ); // the zoom is <= than zoom/2 depending on range of selection
                CP[axisbox( 2 )] << Max( maxSelectedX + z );
                CP[axisbox( 1 )] << Min( minSelectedY -z);
                CP[axisbox( 1 )] << Max( maxSelectedY +z);
            );//
        , // unzoom, handle nothing selected
            CP[axisbox( 2 )] << Min( MinX );
            CP[axisbox( 2 )] << Max( MaxX );
            CP[axisbox( 1 )] << Min( MinY );
            CP[axisbox( 1 )] << Max( MaxY );
        );//
    , //
        selectionNeedsUpdating = 1;// remember something changed while the cursor was inside the graph
    )
);
rs = dt << make row state handler( f );

// use mousebox to detect if the cursor is over the graph and the axis changes need to be locked out
CPP = CP << parent;
Insert Into( CPP, mb = MouseBox( Remove From( cPP, 1 ) ) );

// mostly need to prevent moving the axes during a rectangle select...
outside = 1;// global, is the cursor outside the graph?
selectionNeedsUpdating = 0; // anything happed recently?
mb << setTrack(
    Function( {this, clickpt}, // in the graph, the mouse is not pressed
        outside = (clickpt[1] < 0);// clickpt is -1,-1 when leaving the graph box
        If( selectionNeedsUpdating,
            selectionNeedsUpdating = 0;
            outside = 1;// allow the update to happen, pretend the mouse is out of the graph
            temp = Row State( dt, 1 );
            Row State( dt, 1 ) = Selected State( 1 )/*tickle the handler to trigger the update*/;
            Row State( dt, 1 ) = Selected State( 0 );
            Row State( dt, 1 ) = temp; /* restore*/
        );
    )
) << setTrackEnable( 1 );

//  hook into the graph's update by adding a graphic script.
// use that hook to show the selected points...more
(CP[framebox( 1 )]) << addgraphicsScript(
    //"back", // color goes under the black dot
    "front",// color goes on top
    a = (dt << getselectedrows);
    Fill Color( RGB Color( .2, .8, .8 ) ); // medium cyan
    transparency(.5);// for "front" fill, solid is better for "back"
    For( i = 1, i <= N Rows( a ), i += 1,
        xxx = (dt:xx[a[i]] - dtsize:xmin[1]) / dtsize:xwide[1];
        yyy = (dt:yy[a[i]] - dtsize:ymin[1]) / dtsize:yhigh[1];
        xxx = minX + xxx * (maxX - minX); // same conversion described earlier
        yyy = minY + (1 - yyy) * (maxY - minY);
        // circle's radius is 1/50 of the graph's height
        size = ((CP[axisbox( 1 )] << get Max) - (CP[axisbox( 1 )] << get Min)) / 50;
        Circle( {xxx, yyy}, size, "FILL" );
    );
);
- Mark as New
- Bookmark
- Subscribe
- Mute
- Subscribe to RSS Feed
- Get Direct Link
- Report Inappropriate Content
Re: Navigating "rows" of interest in constellation plot
Here is a simple example of a graph and data table working the way you specified. It uses a simple RowState Handler to trigger the changing of the axes when a row is selected. The JSL is set to reset back to the original axes settings when no rows are selected, but there seems to be a problem.
Names Default To Here( 1 );
// Open Data Table: big class.jmp
// → Data Table( "big class" )
dt = Open( "$SAMPLE_DATA/big class.jmp" );

gb = dt << Graph Builder(
	Size( 525, 454 ),
	Show Control Panel( 0 ),
	Variables( X( :weight ), Y( :height ) ),
	Elements( Points( X, Y, Legend( 6 ) ) )
);
maxX=Report( gb )[axisbox( 1 )] << get Max;
minX=Report( gb )[axisbox( 1 )] << get Min;
maxY=Report( gb )[axisbox( 2 )] << get Max;
minY=Report( gb )[axisbox( 2 )] << get Min;

f = Function( {a},
	Try( theRow = (dt << get selected rows)[1], 0 );

	If( therow > 0, show("found", therow,dt:weight[theRow]);
		Report( gb )[axisbox( 1 )] << Min( dt:weight[therow] - 10 );
		Report( gb )[axisbox( 1 )] << Max( dt:weight[therow] + 10 );
		Report( gb )[axisbox( 2 )] << Min( dt:height[therow] - 10 );
		Report( gb )[axisbox( 2 )] << Max( dt:height[therow] + 10 );
	,
		Report( gb )[axisbox( 1 )] << Min(MinX) ;
		Report( gb )[axisbox( 1 )] << Max(MaxX);
		Report( gb )[axisbox( 2 )] << Min(MinY);
		Report( gb )[axisbox( 2 )] << Max(MaxY);
	);
);
rs = dt << make row state handler( f );- Mark as New
- Bookmark
- Subscribe
- Mute
- Subscribe to RSS Feed
- Get Direct Link
- Report Inappropriate Content
Re: Navigating "rows" of interest in constellation plot
Thanks for sharing that, @txnelson. I was hoping to avoid scripting since I'm newer to JMP, but am willing to go down that road if needed. Dendrograms have this functionality built-in (selecting table rows highlights those items items in the dendrogram) so I was thinking this could be straightforward. I've considered moving to a dendrogram, but I'd lose some other functionality and the dendrogram is also hard to zoom into and view branches clearly with 1000's of rows (it only zooms vertically, but not horizontally).
- Mark as New
- Bookmark
- Subscribe
- Mute
- Subscribe to RSS Feed
- Get Direct Link
- Report Inappropriate Content
Re: Navigating "rows" of interest in constellation plot
I studied this some more. See if this is what you need. (Edit: the video will tell you to use rectangle select in the constellation plot.)
dt = New Table( "Untitled",
    New Column( "x", Numeric, "Continuous", Format( "Best", 12 ), values( J( 2000, 1, Random Uniform() ) ) ),
    New Column( "y", Numeric, "Continuous", Format( "Best", 12 ), values( J( 2000, 1, Random Uniform() ) ) )
);
dt << Hierarchical Cluster(
    Y( :x, :y ),
    Method( "Ward" ),
    Standardize By( "Columns" ),
    Color Clusters( 1 ),
    Show Dendrogram( 0 ),
    Dendrogram Scale( "Distance Scale" ),
    Number of Clusters( 20 ),
    Constellation Plot( 1 )
);

dt << Graph Builder(
    Size( 526, 454 ),
    Show Control Panel( 0 ),
    Variables( X( :x ), Y( :y ) ),
    Elements( Points( X, Y, Legend( 8 ) ) ),
    SendToReport(
        Dispatch( {}, "Graph Builder", FrameBox, {Marker Size( 15 ), Marker Drawing Mode( "Normal" ), Transparency( 0.2 )} )
    )
);- Mark as New
- Bookmark
- Subscribe
- Mute
- Subscribe to RSS Feed
- Get Direct Link
- Report Inappropriate Content
Re: Navigating "rows" of interest in constellation plot
@Craige_Hales , thank you so much for working on this and even making that personalized video! That was very kind of you. I learned a few new things about selecting data in a constellation plot!
However, I didn't see anything in the video that would help me identify a specific row from my data table in the constellation plot (correct me if I'm wrong). Note that I want to highlight a row in my data table and then find that corresponding point among the thousands of points in the constellation plot (not vice versa). I tried your script and I see how selecting a row in the data table highlights it fairly well in graph builder (which is helpful for 2d analysis), but I'm working with higher dimensions of data and so I'd really like to be able to find the point in the constellation plot.
Maybe I'd need to export hierarchical clustering results/coordinates and then use those values to specify where to zoom (using something like @txnelson posted)? Or maybe I should be using a different tool like KDTable() since I'm more interested in learning about the neighbors than I am about the dataset as a whole?
Thanks for your help!
- Mark as New
- Bookmark
- Subscribe
- Mute
- Subscribe to RSS Feed
- Get Direct Link
- Report Inappropriate Content
Re: Navigating "rows" of interest in constellation plot
Here's some starter JSL. (Thanks @txnelson .) It will need some love and care to make it do what you need, but I think it demonstrates the problem and a solution. I'd definitely expect this code to break when JMP has a new major release because it relies on (among other things) the order JMP writes commands to an SVG file, which could change for a number of reasons in the future. (Also after playing with it, I'm not sure it is really what you want, at least not without some more thought about the user interface.)
Edit 1: JSL should run in JMP 15 and 16 now...
Edit 2: attempting to add the try(...)
// *** choose big class or random data, below ***
//
// example JSL for auto-zoom on constellation plot
//
// because the constellation plot uses its own internal coords for the diagram and does
// not expose them, this code may break at any time in the future. Or past. Or now.
// This JSL saves the graph as SVG and attempts to load the SVG as XML and discover
// where the node IDs are plotted. It uses that info to reposition the axes when rows
// are selected. This JSL uses some global flags to decide if the graph is being used
// for row selection, in which case the axis update is delayed so the data does not
// jump around under the selection rectangle. Part of that fix means an extra mouse
// move is required to trigger the redraw. This JSL also uses some features of XML
// import to deal with the SVG pattern. If the SVG writer changes the way it handles
// text or ellipses, it will need rework.

If( 0, // 1 for big class, 0 for big data
    dt = Open( "$sample_data/big class.jmp" );
    dt << Graph Builder( Size( 525, 454 ), Show Control Panel( 0 ), Variables( X( :weight ), Y( :height ) ), Elements( Points( X, Y, Legend( 3 ) ) ) );
    zoom = 10;//<<<<<<<<<<<< adjust for number of nodes
    hc = dt << Hierarchical Cluster(  Y( :height, :weight ),  Color Clusters( 1 ),   Method( "single" ),  Standardize By( "Columns" ),
        Show Dendrogram( 0 ),  Dendrogram Scale( "Distance Scale" ),   Number of Clusters( 5 ),  Constellation Plot( 1 ) );//
,// else make some random data with clusters. 3000 is beginning to lag enough to not be fun, but still usable...
    nObs = 2000;
    dt = New Table( "Untitled",
        New Column( "name", values( 1 :: nObs ) ), // in this table, or bigclass, name is the id
        New Column( "x", Numeric, "Continuous", Format( "Best", 12 ), values( J( nObs, 1, Random normal(random integer(1,3),.25 ) ) )),
        New Column( "y", Numeric, "Continuous", Format( "Best", 12 ), values( J( nObs, 1, Random normal(random integer(1,3),.25 ) ) ) ),
        Set Label Columns( :name )
    );
    dt:name << datatype( "character" );// it needs to match the character data from XML, like bigclass
    dt << Graph Builder( Size( 525, 454 ), Show Control Panel( 0 ), Variables( X( :x ), Y( :y ) ), Elements( Points( X, Y, Legend( 3 ) ) ) );
    zoom = 100;//<<<<<<<<<<<< adjust for number of nodes
    hc = dt << Hierarchical Cluster( Y( :x, :y ),  Color Clusters( 1 ), Method( "FastWard" ),  Standardize By( "Columns" ),
        Show Dendrogram( 0 ), Dendrogram Scale( "Distance Scale" ), Number of Clusters( 9 ),  Constellation Plot( 1 )  );
);

// make an SVG picture of the constellation, name it with an XML extension
CP = Report( hc )[Outline Box( "Constellation Plot" )];
(CP[framebox( 1 )]) << savepicture( "$temp/constellationPlot.svg", "svg" );
try( deletefile("$temp/constellationPlot.svg.xml") );
renamefile("$temp/constellationPlot.svg","constellationPlot.svg.xml");

// open it once to get the constellation coordinates for each row
// this is complicated because one row is at zero degrees and becomes a special case.
// "ellipse" is the marker's center for either case, but text is nested deeper (or not) for
// the two cases, and needs a separate row-maker. By forcing both text fields to be named
// "nodename" they are put in the same column.
// the coords are typically 0..500, see bounding box below.
dtPositions = Open(
    "$TEMP/constellationPlot.svg.xml",
    XML Settings(
        Stack( 1 ),
        Row( "/svg/g/g/g/g/g/g/g" ),
        Row( "/svg/g/g/g/g/g/text" ),
        Col( "/svg/g/g/g/g/g/text", Column Name( "nodename" ), Fill( "Use Once" ), Type( "Character" ) ),
        Col( "/svg/g/g/g/g/g/ellipse/@cx", Column Name( "xx" ), Fill( "+", "/svg/g/g/g/g/g/ellipse/@cx" ), Type( "Numeric" ) ),
        Col( "/svg/g/g/g/g/g/ellipse/@cy", Column Name( "yy" ), Fill( "+", "/svg/g/g/g/g/g/ellipse/@cy" ), Type( "Numeric" ) ),
        // above: ellipse is before text. There are many unlabelled ellipse, the +...@ drops old ones as new ones show up.
        // most recent ellipse center is combined with the text ID for the nodename.
        // either nodename goes in the nodename col; one happens sometimes when a label is horizontal
        // (0 degrees leave out the transform, see alice single-link case).
        Col( "/svg/g/g/g/g/g/g/g/text", Column Name( "nodename" ), Fill( "Use Once" ), Type( "Character" ) )
    ),
    XML Wizard( 0 )// use 1 to reopen wizard if something needs to change for SVG in the future
);

// open it again to get the bounding box coordinates (typ 0..500). They are needed for scaling the data above into 0..1 coords.
dtSize = Open(
    "$temp/constellationPlot.svg.xml",
    XML Settings(
        Stack( 1 ),
        Row( "/svg" ),
        Col( "/svg/g/g/rect/@x", Column Name( "xmin" ), Fill( "Use Once" ), Type( "Numeric" ) ),
        Col( "/svg/g/g/rect/@y", Column Name( "ymin" ), Fill( "Use Once" ), Type( "Numeric" ) ),
        Col( "/svg/g/g/rect/@width", Column Name( "xwide" ), Fill( "Use Once" ), Type( "Numeric" ) ),
        Col( "/svg/g/g/rect/@height", Column Name( "yhigh" ), Fill( "Use Once" ), Type( "Numeric" ) )
    ),
    XML Wizard( 0 )
);

// add the xx and yy cols back into the source table. You probably don't want to save these later. Maybe you'd rather update to the temp file.
dt << Update( With( dtPositions ), Match Columns( :name = :nodename ), Add Columns from Update Table( :xx, :yy ) );
Close( dtPositions, nosave );

// Jim Nelson's code for the row state handler started this...modified a bit. Capture the original axis range.
maxX = CP[axisbox( 2 )] << get Max;
minX = CP[axisbox( 2 )] << get Min;
maxY = CP[axisbox( 1 )] << get Max;
minY = CP[axisbox( 1 )] << get Min;

f = Function( {a}, // this "a" is only the rows that just changed state, sel or unsel
    If( outside, // the mouse is outside of the graph, OK to update the axes
        // for zooming, we need *all* the selected rows to get a bounding box
        a = (dt << getselectedrows);
        If( N Rows( a ) > 0,
            minSelectedX = 99e99;// the loop below captures min and max for x and y
            maxSelectedX = -99e99;
            minSelectedY = 99e99;
            maxSelectedY = -99e99;
            For( i = 1, i <= N Rows( a ), i += 1,
                If( Selected( Row State( dt, a[i] ) ),
                    xxx = (dt:xx[a[i]] - dtsize:xmin[1]) / dtsize:xwide[1]; // SVG 0..500 ->  unit space 0..1
                    yyy = (dt:yy[a[i]] - dtsize:ymin[1]) / dtsize:yhigh[1];
                    // the axis range is typically -10..10, and the 0..500 SVG range has to be mapped back to the axis
                    xxx = minX + xxx * (maxX - minX); // 0..1 -> axis range. This is the Constellation Plot's internal coords
                    yyy = minY + (1 - yyy) * (maxY - minY);
                    minSelectedX = Min( minSelectedX, xxx ); // capture the range of the selected rows
                    maxSelectedX = Max( maxSelectedX, xxx );
                    minSelectedY = Min( minSelectedY, yyy );
                    maxSelectedY = Max( maxSelectedY, yyy );
                )
            );
            If( minSelectedX <= maxSelectedX & minSelectedY <= maxSelectedY, //if we got something captured, zoom in
                z = max( (maxX - minX) / zoom, (maxY - minY) / zoom );
                CP[axisbox( 2 )] << Min( minSelectedX - z ); // the zoom is <= than zoom/2 depending on range of selection
                CP[axisbox( 2 )] << Max( maxSelectedX + z );
                CP[axisbox( 1 )] << Min( minSelectedY -z);
                CP[axisbox( 1 )] << Max( maxSelectedY +z);
            );//
        , // unzoom, handle nothing selected
            CP[axisbox( 2 )] << Min( MinX );
            CP[axisbox( 2 )] << Max( MaxX );
            CP[axisbox( 1 )] << Min( MinY );
            CP[axisbox( 1 )] << Max( MaxY );
        );//
    , //
        selectionNeedsUpdating = 1;// remember something changed while the cursor was inside the graph
    )
);
rs = dt << make row state handler( f );

// use mousebox to detect if the cursor is over the graph and the axis changes need to be locked out
CPP = CP << parent;
Insert Into( CPP, mb = MouseBox( Remove From( cPP, 1 ) ) );

// mostly need to prevent moving the axes during a rectangle select...
outside = 1;// global, is the cursor outside the graph?
selectionNeedsUpdating = 0; // anything happed recently?
mb << setTrack(
    Function( {this, clickpt}, // in the graph, the mouse is not pressed
        outside = (clickpt[1] < 0);// clickpt is -1,-1 when leaving the graph box
        If( selectionNeedsUpdating,
            selectionNeedsUpdating = 0;
            outside = 1;// allow the update to happen, pretend the mouse is out of the graph
            temp = Row State( dt, 1 );
            Row State( dt, 1 ) = Selected State( 1 )/*tickle the handler to trigger the update*/;
            Row State( dt, 1 ) = Selected State( 0 );
            Row State( dt, 1 ) = temp; /* restore*/
        );
    )
) << setTrackEnable( 1 );

//  hook into the graph's update by adding a graphic script.
// use that hook to show the selected points...more
(CP[framebox( 1 )]) << addgraphicsScript(
    //"back", // color goes under the black dot
    "front",// color goes on top
    a = (dt << getselectedrows);
    Fill Color( RGB Color( .2, .8, .8 ) ); // medium cyan
    transparency(.5);// for "front" fill, solid is better for "back"
    For( i = 1, i <= N Rows( a ), i += 1,
        xxx = (dt:xx[a[i]] - dtsize:xmin[1]) / dtsize:xwide[1];
        yyy = (dt:yy[a[i]] - dtsize:ymin[1]) / dtsize:yhigh[1];
        xxx = minX + xxx * (maxX - minX); // same conversion described earlier
        yyy = minY + (1 - yyy) * (maxY - minY);
        // circle's radius is 1/50 of the graph's height
        size = ((CP[axisbox( 1 )] << get Max) - (CP[axisbox( 1 )] << get Min)) / 50;
        Circle( {xxx, yyy}, size, "FILL" );
    );
);- Mark as New
- Bookmark
- Subscribe
- Mute
- Subscribe to RSS Feed
- Get Direct Link
- Report Inappropriate Content
Re: Navigating "rows" of interest in constellation plot
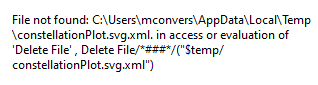
@Craige_Hales, this looks awesome! Thank you again for putting together some really great code! Really appreciate it! I think it might solve my problem. I got an error running it (attached). I'll have time later today to troubleshoot it, but at first glance it seems that the file in line 39 got saved without the ".xml" extension...
- Mark as New
- Bookmark
- Subscribe
- Mute
- Subscribe to RSS Feed
- Get Direct Link
- Report Inappropriate Content
Re: Navigating "rows" of interest in constellation plot
wrap a try( ... ) around the delete. If it isn't there, it won't stop because it can't delete it.
(I started in JMP17 Early Adopter, which was more flexible, and made a small change to make it work in 15 and 16, related to this, but the file already existed, so...incomplete testing. Thanks!)
edit: also keep an eye on the unique id. In Big Class, there are two Roberts, and they get mixed up or lost when the name is used to join the label positions in the constellation back into the original data. The random table has unique names, so not an issue there.
- Mark as New
- Bookmark
- Subscribe
- Mute
- Subscribe to RSS Feed
- Get Direct Link
- Report Inappropriate Content
Re: Navigating "rows" of interest in constellation plot
@Craige_Hales, that "try()" fixed it! Your code works beautifully! What an elegant solution. It has all the functionality I was looking for. I'll dig into the script to understand it better. Thanks a bunch!

- Mark as New
- Bookmark
- Subscribe
- Mute
- Subscribe to RSS Feed
- Get Direct Link
- Report Inappropriate Content
Re: Navigating "rows" of interest in constellation plot
I still might not understand your request, but I can do what you suggest in JMP 16.2 right now. That is, I can select a cluster in the dendrogram and the selected observations are highlighted there, the constellation plot, and the data table. I can select points in the constellation plot and they are highlighted in the dendrogram and data table.I can work in the other direction and select rows in the data table and they are highlighted in the plots in the clustering platform.
Is this behavior what you want, or something else?
Recommended Articles
- © 2026 JMP Statistical Discovery LLC. All Rights Reserved.
- Terms of Use
- Privacy Statement
- Contact Us