- Don’t miss your chance to experience Discovery Summit Europe at our best available rate! Early bird registration through 31 Oct.
- Graph Builder Toolbar streamlines interactive graphing. Creates shortcuts on Report and GraphBuilder Helpers toolbars. Download and install the extension.
- Subscribe to RSS Feed
- Mark Topic as New
- Mark Topic as Read
- Float this Topic for Current User
- Bookmark
- Subscribe
- Mute
- Printer Friendly Page
Discussions
Solve problems, and share tips and tricks with other JMP users.- User Community
- :
- Discussions
- :
- Re: Multiple indicator responses and multiple continuous predictors

- Mark as New
- Bookmark
- Subscribe
- Mute
- Subscribe to RSS Feed
- Get Direct Link
- Report Inappropriate Content
Multiple indicator responses and multiple continuous predictors
Hi again, I'm using JMP Pro 15.2.1. I have a dataset where each observation has three continuous predictors and five indicator (y/n) responses. For each observation, any or all of the indicators may be present. I want to model the simultaneous effects of several predictors on a multidimensional response variable.
I can't seem to find the correct approach to this data. JMP balks at multiple categorical responses or the fact that my predictors are continuous.
Accepted Solutions


- Mark as New
- Bookmark
- Subscribe
- Mute
- Subscribe to RSS Feed
- Get Direct Link
- Report Inappropriate Content
Re: Multiple indicator responses and multiple continuous predictors
Makes sense, @gchesterton . You want to simultaneously understand the effects of X1 ... X3 on all responses Y1 ... Y5.
We could get very philosophical about what you mean by "responses are not independent" and we could explore sophisticated modelling techniques that treat Y1 ... Y5 as some kind of grouped, multivariate response.
But the pragmatic approach that people will use 99% of the time is to build separate models for each of Y1 ... Y5 against X1 .... X3 and then profile them together:
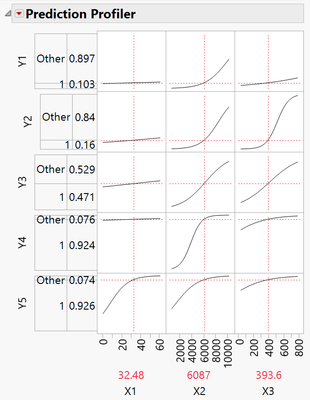
These are still separate models.
The process to do this is to save the Probability Formula for each model:
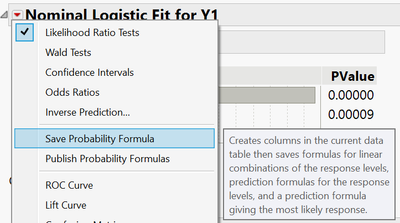
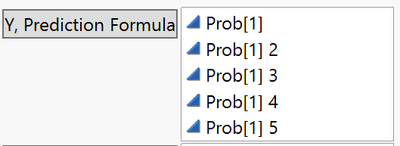
And then add the Prob[1] prediction formula column to Y, Prediction Formula role in Graph > Profiler.
I hope this helps,
Phil


- Mark as New
- Bookmark
- Subscribe
- Mute
- Subscribe to RSS Feed
- Get Direct Link
- Report Inappropriate Content
Re: Multiple indicator responses and multiple continuous predictors
You can ignore me, but I'm even more confused. I don't understand "states of Y2-Y5"? Are these different characteristics of the "sample"? Are humans "observing" a sample and determining 0 or 1? What does 0 and 1 mean? Arte these operationally defined (per Deming)?
If the response is a vector, why don't you quantify magnitude and direction?
If the response is a categorical response from human sensory perception, I would try to create more categories and use ordinal scales. If you are concerned with human bias, make sure the scale is a comparison scale not based on emotion. I would add repeated measures both within human and between human (same "sample" measured at least twice by same human and them other humans). You can use simple plots to see if there consistent biases from a particular human(s) and you can use averaging to reduce each of those components of variation.
- Mark as New
- Bookmark
- Subscribe
- Mute
- Subscribe to RSS Feed
- Get Direct Link
- Report Inappropriate Content
Re: Multiple indicator responses and multiple continuous predictors
Hi @gchesterton ,
I might be misunderstanding what you are trying to do but this should not be a problem in JMP.
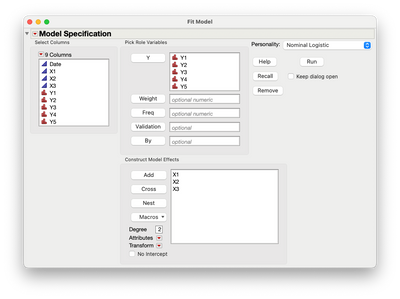
Analyze > Fit Model.
Specify your 5 binary responses in the Y role.
Add your 3 continuous predictors to the Construct Model Effects outline.
Run.
Is that what you have tried? If so, what was the problem?
It always helps if you can attach an illustrative example .jmp data table. Please no sensitive data though.
I hope this helps,
Phil
- Mark as New
- Bookmark
- Subscribe
- Mute
- Subscribe to RSS Feed
- Get Direct Link
- Report Inappropriate Content
Re: Multiple indicator responses and multiple continuous predictors
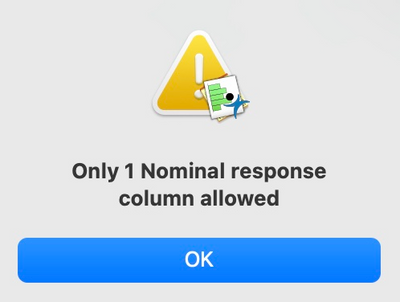
Thanks @Phil_Kay , your proposed approach is precisely what I did and what I expected to work. But JMP is telling me that I can include only one nominal response. As you might guess, my nominal responses are each in their own columns. Obviously I could stack them into a single data column and add a source label column.
- Mark as New
- Bookmark
- Subscribe
- Mute
- Subscribe to RSS Feed
- Get Direct Link
- Report Inappropriate Content
Re: Multiple indicator responses and multiple continuous predictors
I'm not able to replicate that behaviour.
Again, attaching example data to illustrate the query would really help.
Phil
- Mark as New
- Bookmark
- Subscribe
- Mute
- Subscribe to RSS Feed
- Get Direct Link
- Report Inappropriate Content
Re: Multiple indicator responses and multiple continuous predictors
I've attached a comma separated text file. This is actual raw data with the headers changed. The predictors should be standardized/transformed but I don't think that's the issue at the moment.
- Mark as New
- Bookmark
- Subscribe
- Mute
- Subscribe to RSS Feed
- Get Direct Link
- Report Inappropriate Content
Re: Multiple indicator responses and multiple continuous predictors

- Mark as New
- Bookmark
- Subscribe
- Mute
- Subscribe to RSS Feed
- Get Direct Link
- Report Inappropriate Content
Re: Multiple indicator responses and multiple continuous predictors
I opened the CSV file in the current release, JMP Pro 17.2, and changed the modeling type of all Y columns to Nominal. I completed the Fit Model launch dialog as you indicated. I received the following results without any errors:
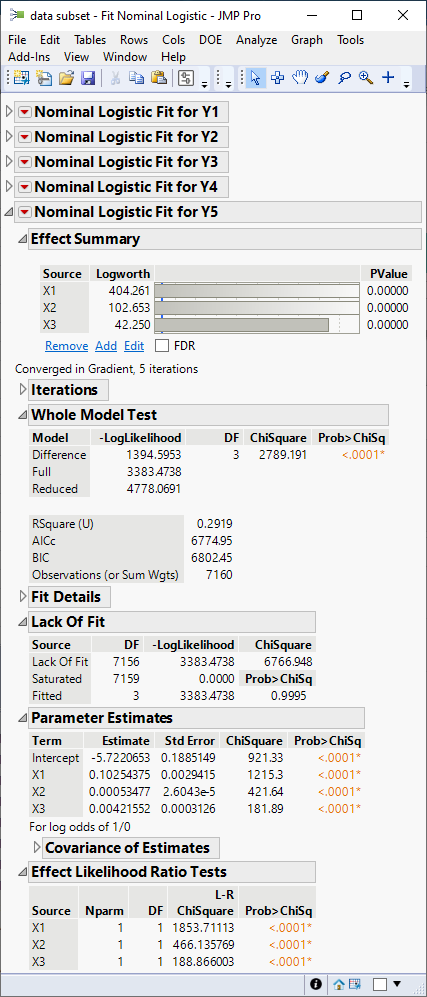
(Note that the report for the first four Ys is closed for sake of space.)
- Mark as New
- Bookmark
- Subscribe
- Mute
- Subscribe to RSS Feed
- Get Direct Link
- Report Inappropriate Content
Re: Multiple indicator responses and multiple continuous predictors
Hi, @gchesterton .
I still can't reproduce your problem. Maybe because I am on JMP Pro 17.1.0 on Windows?
I suggest you contact tech support ([email protected]).
In any case, it is probably good to understand that what you will get from Fit Model will, in fact, be separate models for each response, but all in one JMP report window. So you could work around your issue by fitting each model separately - the models will be the same.
- Mark as New
- Bookmark
- Subscribe
- Mute
- Subscribe to RSS Feed
- Get Direct Link
- Report Inappropriate Content
Re: Multiple indicator responses and multiple continuous predictors
Indeed I can produce a separate model for each nominal response. But my motivation for inserting all five response variables in the response window was not to simplify the process of doing five separate models. Instead, my thought is that I'm dealing with a multi-dimensional response. These responses are not independent, so I thought by including multiple response variables in a single model fit that it would recognize them as a multivariate response. In other words, the joint state of Y1-5 with predictors X1,2,3.
I could model Y1 ~ X1+X2+X3 + Y2+Y3+Y4+Y5 but I think what I really want is Y1 + ... + Y5 ~ X1 + X2 + X3.
- Mark as New
- Bookmark
- Subscribe
- Mute
- Subscribe to RSS Feed
- Get Direct Link
- Report Inappropriate Content
Re: Multiple indicator responses and multiple continuous predictors
Makes sense, @gchesterton . You want to simultaneously understand the effects of X1 ... X3 on all responses Y1 ... Y5.
We could get very philosophical about what you mean by "responses are not independent" and we could explore sophisticated modelling techniques that treat Y1 ... Y5 as some kind of grouped, multivariate response.
But the pragmatic approach that people will use 99% of the time is to build separate models for each of Y1 ... Y5 against X1 .... X3 and then profile them together:
These are still separate models.
The process to do this is to save the Probability Formula for each model:
And then add the Prob[1] prediction formula column to Y, Prediction Formula role in Graph > Profiler.
I hope this helps,
Phil
Recommended Articles
- © 2026 JMP Statistical Discovery LLC. All Rights Reserved.
- Terms of Use
- Privacy Statement
- Contact Us