cancel
Showing results for 
Show  only  | Search instead for 
Did you mean: 
  • Instantly extract effect sizes, F-ratios, and FDR-adjusted p-values from your models with the Calculate Effects Sizes extension, available now in the JMP Marketplace!
  • New to JMP? Join us Sept. 23-24 for the Early User Edition of Discovery Summit, tailor-made for new users. Register now for free!
  • Use World Cup data to build models, explore spatial relationships, and create informative visualizations in JMP. Register. July 17, 2 pm US Eastern Time.

Discussions

Solve problems, and share tips and tricks with other JMP users.
Choose Language Hide Translation Bar
seyberg
Level I

Multiple Fits Within a Graph

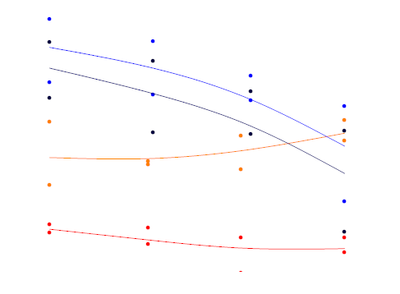
Hey guys, I am trying to visually represent trends in many groups of sets of data as efficiently as possible.  My thoughts were to use an XY bivariate and draw splines through points, as shown below.  I did this one by drawing/editing splines one data set at a time using the row filter, but this is very time consuming over a large data set and I can't figure out how to automate it into a script.  Is there a way to script many splines in a data set?  Alternately, are there easier ways to run this kind of visual analysis on many sets of data?

1527_Graph.png

1 REPLY 1
bstults
Level I

Re: Multiple Fits Within a Graph

The smoother in graph builder is a subic spline with a lambda of 0.05.  If that works for your situation, then your plot could create a seperate smoother line for each grouping in graph builder by overlaying a column whose values correpsond to the groupings you want the points/smoothers divided into.

If you want to stay with a bivariate plot, you can also do the same thing using the "group by" option where you would select a column whose values correspond to the groupings.

Recommended Articles