- Subscribe to RSS Feed
- Mark Topic as New
- Mark Topic as Read
- Float this Topic for Current User
- Bookmark
- Subscribe
- Mute
- Printer Friendly Page
Discussions
Solve problems, and share tips and tricks with other JMP users.- JMP User Community
- :
- Discussions
- :
- Re: Multidimensional Scaling Plot
- Mark as New
- Bookmark
- Subscribe
- Mute
- Subscribe to RSS Feed
- Get Direct Link
- Report Inappropriate Content
Multidimensional Scaling Plot
Hallo,
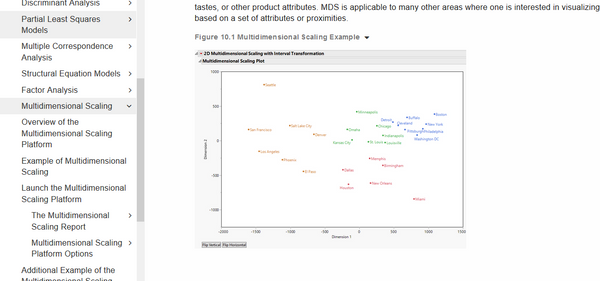
Wie waren die Farben in Multidimensiona Scaling Plot?
nach dem Beispiel des Links
https: //www.jmp.com/support/help/en/15.1/? os = win & source = application & utm_source = helpmenu & utm_medium = a ...
,
Danke für Ihre Hilfe.
- Mark as New
- Bookmark
- Subscribe
- Mute
- Subscribe to RSS Feed
- Get Direct Link
- Report Inappropriate Content
Re: Multidimensional Scaling Plot
1) Row > Color or Mark by Column
2) Column Menu > Color Properties > Value Color
3) Plot Menu > Row Legend..
Now, it you are asking about how to set the groups of color, I suspect that it was set using Clustering approach
- Mark as New
- Bookmark
- Subscribe
- Mute
- Subscribe to RSS Feed
- Get Direct Link
- Report Inappropriate Content
Re: Multidimensional Scaling Plot
@Mi ,
The Flight Distances.jmp data table has a table script named Hierarchical Cluster. If you run that script and select the options: Color Clusters and Number Of Clusters which will initiate a dialog. Set the number to 5. The 5 clusters will match the color groups displayed in the .PNG and link in your post.
@Thierry_S was correct, this post just adds details.
- Mark as New
- Bookmark
- Subscribe
- Mute
- Subscribe to RSS Feed
- Get Direct Link
- Report Inappropriate Content
Re: Multidimensional Scaling Plot
Hello,
that's how it worked!
Unfortunately I don't get a heatmap for Cluster,
even though I activated two-way clustering.
Why does this not appear?
Thanks for your help.
- Mark as New
- Bookmark
- Subscribe
- Mute
- Subscribe to RSS Feed
- Get Direct Link
- Report Inappropriate Content
Re: Multidimensional Scaling Plot
I was able to get a heat map. I set Number of Clusters to 5 first, then requested Two Way Clustering. ??
- Mark as New
- Bookmark
- Subscribe
- Mute
- Subscribe to RSS Feed
- Get Direct Link
- Report Inappropriate Content
Re: Multidimensional Scaling Plot
How can I remove the lines in the Multidimensional Scaling Plot?
Thanks.
- Mark as New
- Bookmark
- Subscribe
- Mute
- Subscribe to RSS Feed
- Get Direct Link
- Report Inappropriate Content
Re: Multidimensional Scaling Plot
Hello,
thank you very much for the really very quick answer.
It worked!
The problem was that I, at least I think so, under
"file, Prefenrences, Hierarchical Cluster, Two Way Clustering
Then via Analyze, Clustering, Hierarchical
Cluster I clicked "Two Way Clustering" again.
Thanks for the help!
- Mark as New
- Bookmark
- Subscribe
- Mute
- Subscribe to RSS Feed
- Get Direct Link
- Report Inappropriate Content
Re: Multidimensional Scaling Plot
How can I remove the lines in the Multidimensional Scaling Plot?
Recommended Articles
- © 2026 JMP Statistical Discovery LLC. All Rights Reserved.
- Terms of Use
- Privacy Statement
- Contact Us


