- Subscribe to RSS Feed
- Mark Topic as New
- Mark Topic as Read
- Float this Topic for Current User
- Bookmark
- Subscribe
- Mute
- Printer Friendly Page
Discussions
Solve problems, and share tips and tricks with other JMP users.- JMP User Community
- :
- Discussions
- :
- Re: Modeling longitudinal data and consider potential impact of process history
- Mark as New
- Bookmark
- Subscribe
- Mute
- Subscribe to RSS Feed
- Get Direct Link
- Report Inappropriate Content
Modeling longitudinal data and consider potential impact of process history
Hi community,
I have a question on how to handle a modeling situation. I have a set of longitudinal data like the one in the table below:
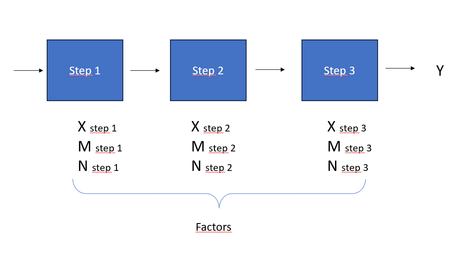
I have some factors (X, M and N) that are evaluated each time in different steps of a process (step 1, step 2 and step 3). I measure an answer Y and then the idea is to identify which factor (and from which step) is more influential on the outcome Y. To make things clearer (if necessary), the situation can be shematized as follows:
This situation (longitudinal data) seems to me be a case for "mixed models", but i do not really know how to translate this case to JMP (I'm not very experienced with mixed models).
I was thinking that my model could be something like:
Y = Xstep1 + Xstep2 + Xstep3 + Xstep1*Xstep2 + Xstep1*Xstep3 + ....
I'm adding the interactions between defferent steps on the process because recently I saw a presentation that doing this you can consider also the impact of process history. What do you think ? is the correct way to model the situation according to my objective (identify which factor and from which step is more influential on my answer Y) ?
Also, as a second question: According to what I've seen, in mixed models you have fixed and random effects, but I'm not seeing very clearly that part in the model I'm proposing above.
Thank you for any help.
Julian
- Mark as New
- Bookmark
- Subscribe
- Mute
- Subscribe to RSS Feed
- Get Direct Link
- Report Inappropriate Content
Re: Modeling longitudinal data and consider potential impact of process history
I could see how a mixed model or structural equation modeling could be used to address the problem as you have stated it; however, structuring the data in 9 columns for each run is a little more common.
step1-x
step1-m
step1-n
step2-x
step2-m
step2-n...etc
Then include your Y variables as separate columns.
In Analyze/Fit Model, for adding Effects, look for the macro button, and use "Factorial to degree" to get the main effects and 2-way interactions, or change Degree to 3 to also get 3-way interactions.
- Mark as New
- Bookmark
- Subscribe
- Mute
- Subscribe to RSS Feed
- Get Direct Link
- Report Inappropriate Content
Re: Modeling longitudinal data and consider potential impact of process history
Thank you @Byron_JMP for your answer
Recommended Articles
- © 2026 JMP Statistical Discovery LLC. All Rights Reserved.
- Terms of Use
- Privacy Statement
- Contact Us


