- Subscribe to RSS Feed
- Mark Topic as New
- Mark Topic as Read
- Float this Topic for Current User
- Bookmark
- Subscribe
- Mute
- Printer Friendly Page
Discussions
Solve problems, and share tips and tricks with other JMP users.- JMP User Community
- :
- Discussions
- :
- Model 'locked' to first point value

- Mark as New
- Bookmark
- Subscribe
- Mute
- Subscribe to RSS Feed
- Get Direct Link
- Report Inappropriate Content
Model 'locked' to first point value
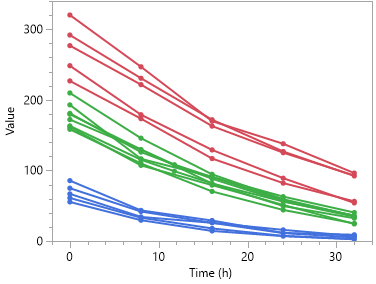
I'm studying a decay process as shown for a number of samples below. The higher the starting point, the faster the decay. The idea is to predict the value at any timeopint from measured Initial value. I would like to 'lock' the model so that at timepoint zero, the predicted value is exactly the measured Initial value. If not, predictions as short time times can be very off for some samples, as in graph below.
Any help on how to do this is very welcome!


- Mark as New
- Bookmark
- Subscribe
- Mute
- Subscribe to RSS Feed
- Get Direct Link
- Report Inappropriate Content
Re: Model 'locked' to first point value
Hi @Ake ,
What platform are you using to fit the data? There should be a way to constrain the y-intercept of your fit to the first data point of the curve, but this might depend on which platform you're using.
UPDATE: I made a simple table with some exponential decaying functions and then fit it using the Analyze > Specialized Modeling > Nonlinear and used a Fit Exponential 3P decay to fit the data. Then, I saved the prediction formula to the data table and then changed the offset value to be the starting value of DecayX. This should help to get you in the right direction, I hope.
Hope this helps!,
DS
- Mark as New
- Bookmark
- Subscribe
- Mute
- Subscribe to RSS Feed
- Get Direct Link
- Report Inappropriate Content
Re: Model 'locked' to first point value
Hi and thanks for the fast response! I will practice putting my questions more clearly! :) I'm using Fit Model (jmp 16), putting just Initial Value and Time as factors into a response surface.
I would want only one predictor function for all samples, with only the initial value as input. My (little) under standing is that Nonlinear fit gives you one predictor function per sample?
Best, Åke
UPDATE:
Hi SDF1,
You are right, I try to predict the value V at any time t from just the initial value of V. It seems your suggestion requires me to know the constants for each sample separately. I need to assume all samples have a common decay curvature, so that I only need to know initV to do the prediction for every new sample. I'm no completely sure the curvature is completely exponential, so fit model and transformations seems an ideal tool to find the best curvature (the measurement is physical, so no best theoretical curvature), except that I don't know how to get rid of the difference between V and Pred V at time zero.
I included my dataset, with a prediction Pred V (fit model) from using fit model, and a prediction formula Prev V (solver) constructed by hand and constants found by using solver in Excel.
The latter fulfills my desire to give V = initV at time zero, but using Excel feels like a step backward. I am hoping to do something similar or better in jmp.
- Mark as New
- Bookmark
- Subscribe
- Mute
- Subscribe to RSS Feed
- Get Direct Link
- Report Inappropriate Content
Re: Model 'locked' to first point value
Hi @Ake ,
Is there a reason why you are using the fit model platform and a response surface model? Do all your decay functions have the same time constant? If you already have a formula or equation that should predict the decay process, I would use that. But, once you have a prediction formula from whatever platform you use, you can always go in and edit the y-intercept (what I believe is your initial value) to be the first element of the column :X[1]. Can you share your data table and/or your prediction formula?
DS
UPDATE:
I've been thinking about your task at hand, and it sounds like you are studying a process that depends on time and the initial conditions. If you have your data table organized with a column for time, columns for each of the decay measurements, you might want to change it to a "stacked" format, where you stack the data based on the decay columns. This will create a data table that you can "fit as one" in the Fit Curve platform. Attached is an updated data table with some scripts you can run from the green triangles to show what I did. The functions I generate are simple exponential decay functions that have the functional form:

where f_0 is the initial value. There are only two parameters going into this function: f_0 and time, t; hence my choice of the 2P exponential decay function in the Fit Curve platform. If you fit the curve as I did, you can manually set the initial value if need be, and it should handle it appropriately. Without being able to see your dat table or how you're going about the fit, it's challenging to provide additional help.
- Mark as New
- Bookmark
- Subscribe
- Mute
- Subscribe to RSS Feed
- Get Direct Link
- Report Inappropriate Content
Re: Model 'locked' to first point value
Or here. Gosh I'm new to forum posting! :)
- Mark as New
- Bookmark
- Subscribe
- Mute
- Subscribe to RSS Feed
- Get Direct Link
- Report Inappropriate Content
Re: Model 'locked' to first point value
I realize I should have put my update as a reply for you to discover it, so here is a pointer to above..
- Mark as New
- Bookmark
- Subscribe
- Mute
- Subscribe to RSS Feed
- Get Direct Link
- Report Inappropriate Content
Re: Model 'locked' to first point value
Hi @Ake ,
If you want to "tag" someone in the forums use the "@" symbol and then the web interface will suggest people to tag -- usually only those related to the thread, but if you know another user's name, you can type that in and it'll bring up their link.
Anyway, if your data comes from a physical process, then I would imagine that there should be a known equation that explains the decay curve that is observed. But, JMP can still do what you want. It actually helps that your data is in a stacked format.
One way you can do this is the following: go Analyze > Specialized Modeling > Fit Curve, then cast the columns as shown.

You'll get a screen that looks like this, go to the red hot-button > Exponential Growth and Decay > Fit Exponential 2P (two-parameter):

You then get this in the report output:

If you go to the red hot-button next to Exponential 2P then select Save Formulas > Save Prediction Formula

You'll then get a column in your data table that has the prediction formula based on the "Type":

You can see the values at :Time=0 are very close to the original values. And if you do a graph builder of V vs V Predictor(), see the green script I saved to the data table. I have some scripts saved to the data table that you can check out. You can try swapping the Sample and Type in the Group and Z. They result in slightly different models, because one is grouped by :Sample and the other by :Type.
This should get you want you want. When grouped by type, you can see the decay constants in the exponents are not identical to each other. The only other way you can fix the values of the y-intercept (that I can think of) is to do a fit y by x with Type in the By field. But, you'll want to do a transformation of the V column by taking the log of it. The graphs should now be linear and when you fit a line to the data, you can then do Fit Special... and force the y-intercept to the correct value of the log of the initial V -- I've saved a script to the data table that you can review -- it is set up to do each sample and type separately. The slopes are not the same, so the exponential decay constants won't be the same either.
All this should at least get you well on your way. Cool data set and project by the way!
Hope this helps!,
DS

Recommended Articles
- © 2026 JMP Statistical Discovery LLC. All Rights Reserved.
- Terms of Use
- Privacy Statement
- Contact Us