- Don’t miss your chance to experience Discovery Summit Europe at our best available rate! Early bird registration through 31 Oct.
- Graph Builder Toolbar streamlines interactive graphing. Creates shortcuts on Report and GraphBuilder Helpers toolbars. Download and install the extension.
- Subscribe to RSS Feed
- Mark Topic as New
- Mark Topic as Read
- Float this Topic for Current User
- Bookmark
- Subscribe
- Mute
- Printer Friendly Page
Discussions
Solve problems, and share tips and tricks with other JMP users.- User Community
- :
- Discussions
- :
- Re: Missing items in Distribution

- Mark as New
- Bookmark
- Subscribe
- Mute
- Subscribe to RSS Feed
- Get Direct Link
- Report Inappropriate Content
Missing items in Distribution
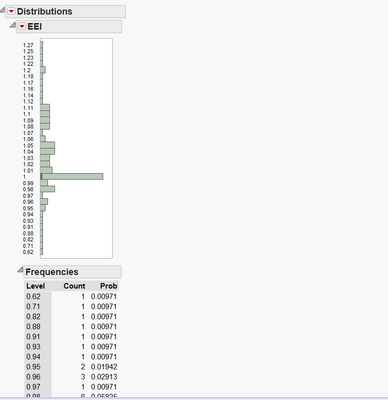
I am not able to see "Box plot","Quantiles","Summary Statistics" etc. when I plot a distribution for my data set in JMP. Let me know for possible resolution in this regard.
Accepted Solutions

- Mark as New
- Bookmark
- Subscribe
- Mute
- Subscribe to RSS Feed
- Get Direct Link
- Report Inappropriate Content
Re: Missing items in Distribution
That output indicates that the column's modeling type is defined as Ordinal or Nominal, as hlrauch already has suggested.
Open the column info dialog by double-clicking on the header and set Data Type to Numeric and Modeling Type to Continuous.
- Mark as New
- Bookmark
- Subscribe
- Mute
- Subscribe to RSS Feed
- Get Direct Link
- Report Inappropriate Content
Re: Missing items in Distribution
Have you tried to click on the little red triangle above the histogram? There you should be able to select these options, among other.
Normally they are included by default. Check your Preferences -> Platforms -> Distribution.

- Mark as New
- Bookmark
- Subscribe
- Mute
- Subscribe to RSS Feed
- Get Direct Link
- Report Inappropriate Content
Re: Missing items in Distribution
Also check that the variable's Modeling Type is "Continuous" instead of "Nominal" or "Ordinal." There should be a blue triangle next to it in the Columns pane, or you can check the modeling type by selecting "Column Info" from the "Cols" menu. JMP provides different graphs and analyses depending on the selected modeling type.
Howard

- Mark as New
- Bookmark
- Subscribe
- Mute
- Subscribe to RSS Feed
- Get Direct Link
- Report Inappropriate Content
Re: Missing items in Distribution
Jeff,
This is original data.
Appreciate your help!
Liang
- Mark as New
- Bookmark
- Subscribe
- Mute
- Subscribe to RSS Feed
- Get Direct Link
- Report Inappropriate Content
Re: Missing items in Distribution
Guys,
Thanks for the feedback. I tried the options suggested but the issue is not resolved. I have attached screen shot of the distribution from my JMP data file for better understanding. As can be seen it does not have "Box plot","Quantiles","Summary Statistics" etc. Let me know for any change in settings to be done.
- Mark as New
- Bookmark
- Subscribe
- Mute
- Subscribe to RSS Feed
- Get Direct Link
- Report Inappropriate Content
Re: Missing items in Distribution
That output indicates that the column's modeling type is defined as Ordinal or Nominal, as hlrauch already has suggested.
Open the column info dialog by double-clicking on the header and set Data Type to Numeric and Modeling Type to Continuous.
- Mark as New
- Bookmark
- Subscribe
- Mute
- Subscribe to RSS Feed
- Get Direct Link
- Report Inappropriate Content
Re: Missing items in Distribution
Thanks to MS, I tried the suggested option and it worked!. Thanks for the resolution.
Recommended Articles
- © 2026 JMP Statistical Discovery LLC. All Rights Reserved.
- Terms of Use
- Privacy Statement
- Contact Us