For nominal values there is the setting in GraphBuilder to Include Missing Categories
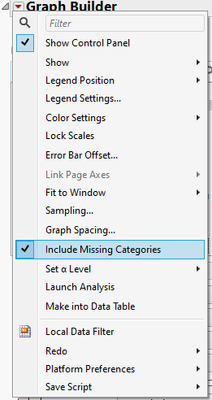
Then, instead of ignoring rows with missing values, Graph Builder will display an additional item on the axis and/or in the legend - and SHOW the entries:
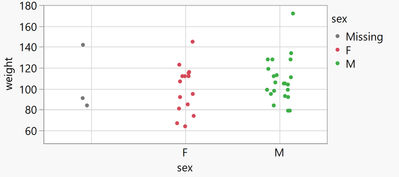
If there are missing entries in a column that has continuous values - the values will not be displayed, even with Include Missing Categories enabled. Where should they?
As a workaround, the user could create a transform column (is missing -> 1) and display it in addition to the continuous values.
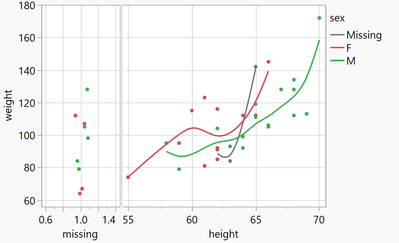
Is there an official / more straightforward / nicer solution?
Graph Builder(
	Transform Column(
		"missing",
		Format( "Fixed Dec", 5, 0 ),
		Formula( If( Is Missing( :height ), 1, . ) )
	),
	Size( 566, 413 ),
	Set α Level( 0.01 ),
	Summary Statistic( "Median" ),
	Graph Spacing( 4 ),
	Variables( X( :missing ), X( :height ), Y( :weight ), Overlay( :sex ) ),
	Relative Sizes( "X", [58 151] ),
	Elements(
		Position( 1, 1 ),
		Points( X, Y, Legend( 20 ) ),
		Smoother( X, Y, Legend( 23 ) )
	),
	Elements(
		Position( 2, 1 ),
		Points( X, Y, Legend( 21 ) ),
		Smoother( X, Y, Legend( 22 ) )
	)
)



