- Instantly extract effect sizes, F-ratios, and FDR-adjusted p-values from your models with the Calculate Effects Sizes extension, available now in the JMP Marketplace!
- New to JMP? Join us Sept. 23-24 for the Early User Edition of Discovery Summit, tailor-made for new users. Register now for free!
- Subscribe to RSS Feed
- Mark Topic as New
- Mark Topic as Read
- Float this Topic for Current User
- Bookmark
- Subscribe
- Mute
- Printer Friendly Page
Discussions
Solve problems, and share tips and tricks with other JMP users.- JMP User Community
- :
- Discussions
- :
- Median Absolute Deviation --> Export To Table for further tSNE

- Mark as New
- Bookmark
- Subscribe
- Mute
- Subscribe to RSS Feed
- Get Direct Link
- Report Inappropriate Content
Median Absolute Deviation --> Export To Table for further tSNE
Dear all,
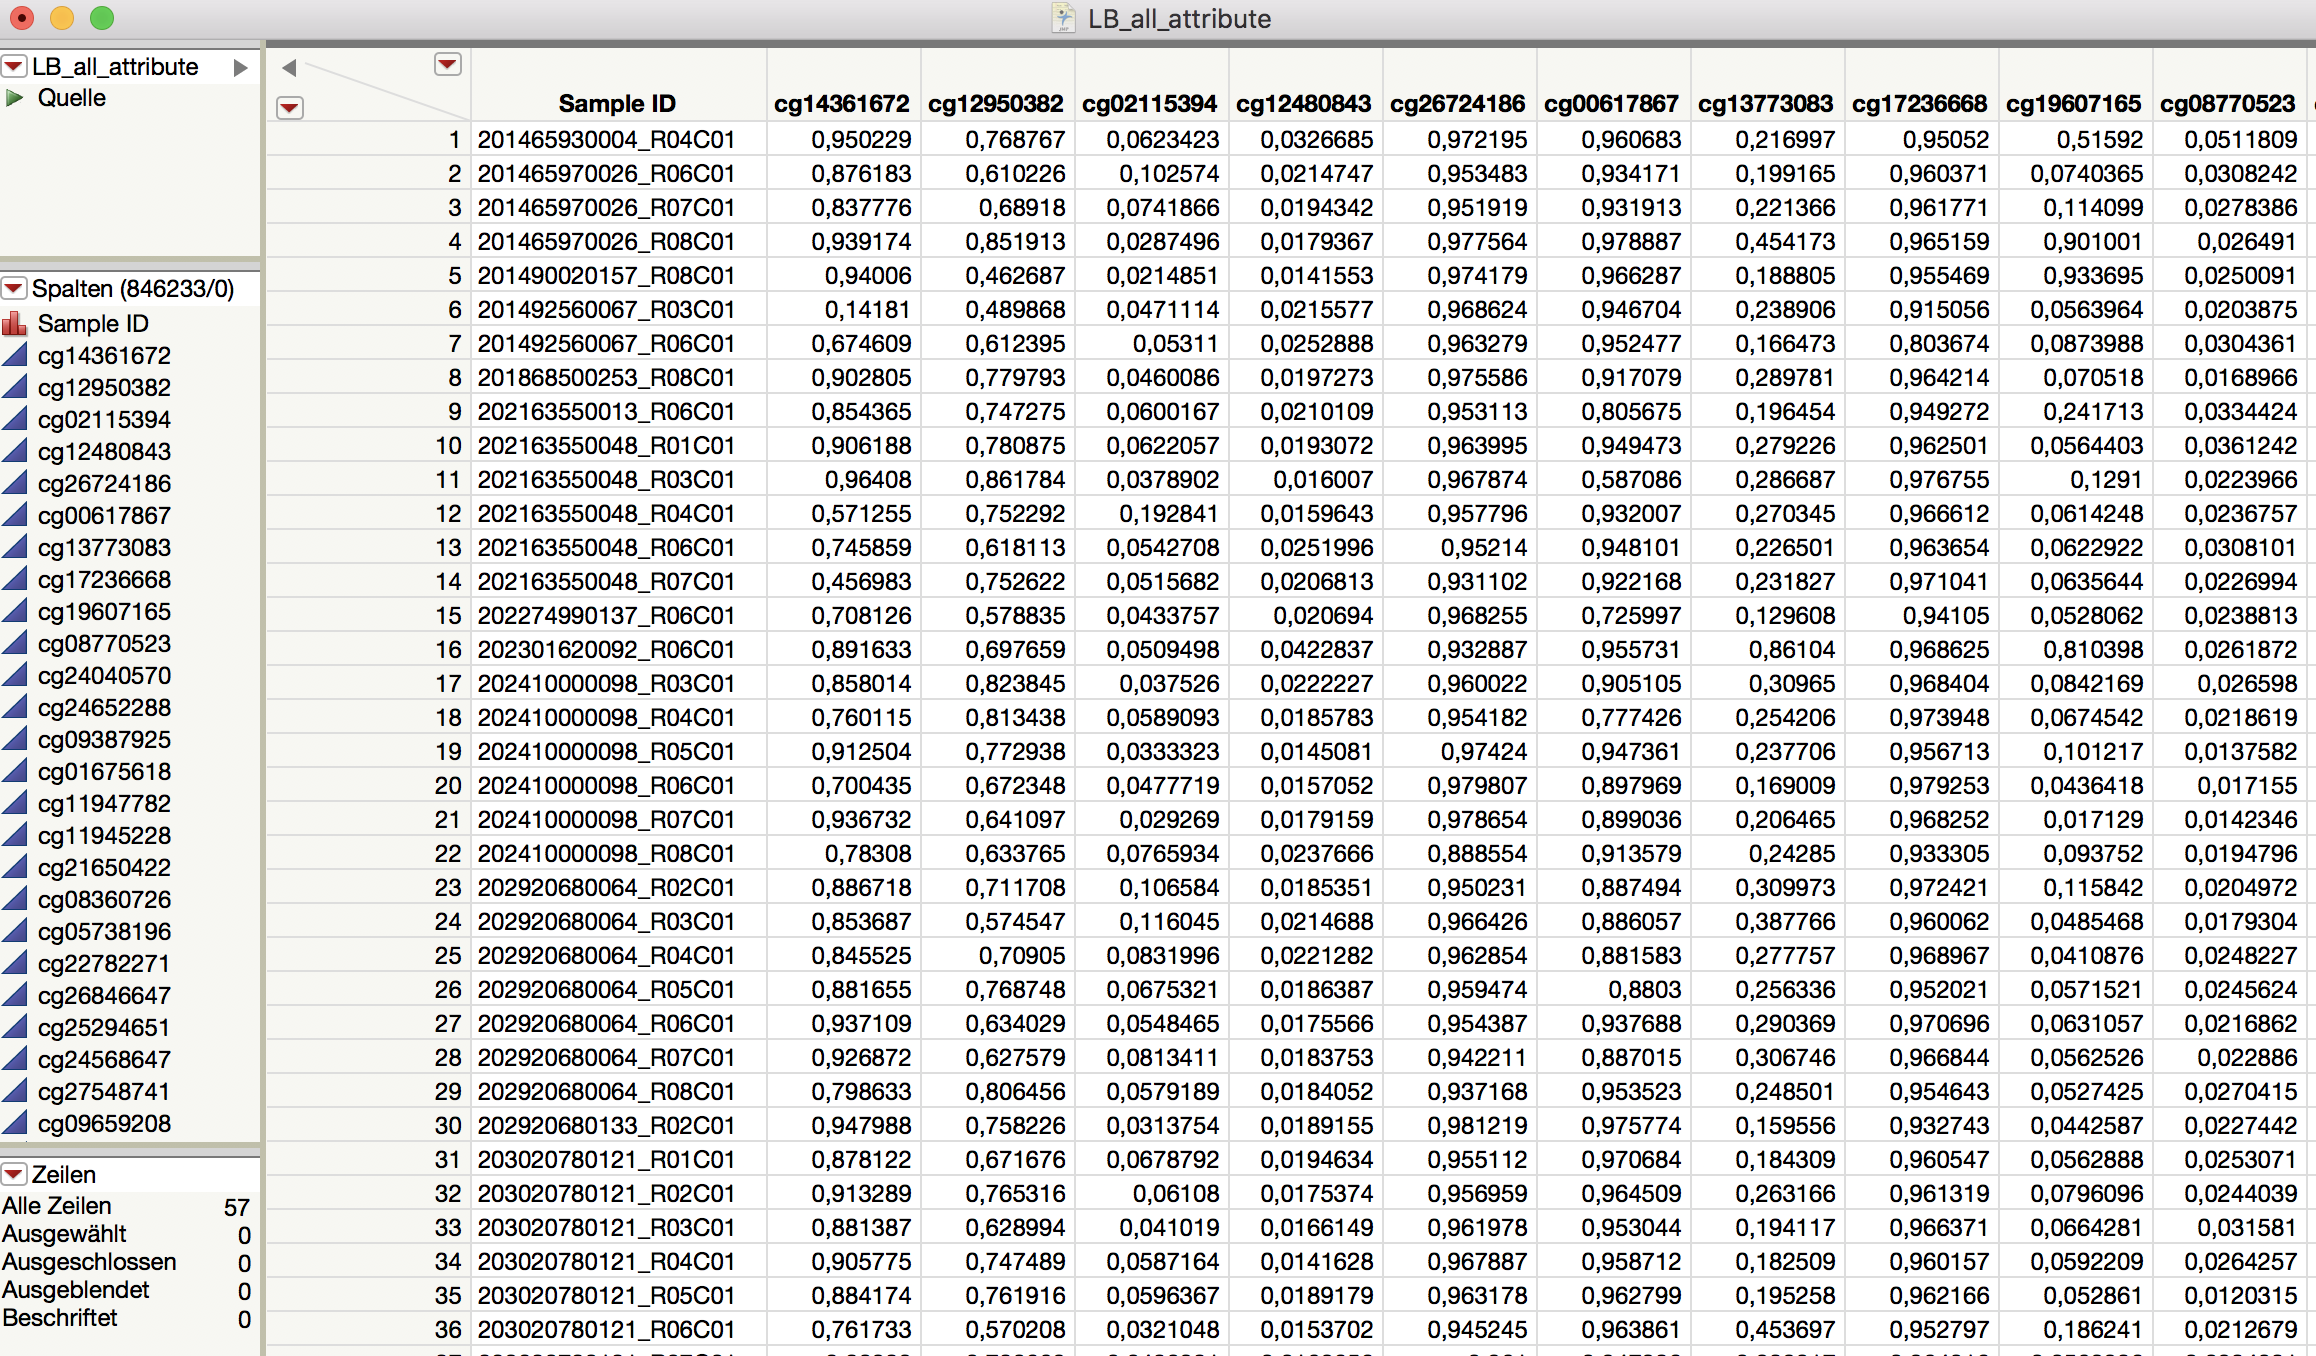
I am currently working on a project using 57 samples and >800 000 variables (see image attached). Now I would like to reduce the variables by using only the ones with highest median absolute deviation (MAD). The goal would be to process the data further with PC Analysis, followed by a t-SNE (I am using the nice JMP add-in).
So far I am struggling with the identification of the variables with highest MAD and directly export these variables to a data table.
Thanks in advance, best regards
Pat

- Mark as New
- Bookmark
- Subscribe
- Mute
- Subscribe to RSS Feed
- Get Direct Link
- Report Inappropriate Content
Re: Median Absolute Deviation --> Export To Table for further tSNE
Here is a simple example of generating the MAD. I suggest you turn it into a function, and then create a new data table with one row, and your >800000 columns.
Names Default To Here( 1 );
dt = Open( "$SAMPLE_DATA/big class.jmp" );

theMatrix = Column( dt, "height" ) << get as matrix;
MAD = Quantile( .5, Abs( theMatrix - Quantile( .5, theMatrix ) ) );- Mark as New
- Bookmark
- Subscribe
- Mute
- Subscribe to RSS Feed
- Get Direct Link
- Report Inappropriate Content
Re: Median Absolute Deviation --> Export To Table for further tSNE
Here is a more complete example that you may be able to directly use by just changing the reference to the "dt" data table, and the column in the output table to delete(i.e. Sample ID)
Names Default To Here( 1 );
dt = Open( "$SAMPLE_DATA/semiconductor capability.jmp" );
dt << select where(row()==1);

dtMAD = dt <<  Subset(
	Selected Rows( 0 ),
	Rows( [1] ),
	Selected columns only( 0 )
);
dtMAD << delete columns({"Lot_id","wafer","Wafer id in lot ID","site"});

For( i = 1, i <= N Cols( dtMAD ), i++,
	theMatrix = Column( dt, Column( dtMAD, i ) << get name ) << get as matrix;
	Column( dtMAD, i )[1] = Quantile( .5, Abs( theMatrix - Quantile( .5, theMatrix ) ) );
);
- Mark as New
- Bookmark
- Subscribe
- Mute
- Subscribe to RSS Feed
- Get Direct Link
- Report Inappropriate Content
Re: Median Absolute Deviation --> Export To Table for further tSNE
I initially mis-read 'median' as 'mean' and wrote the following: It takes a few seconds on my Mac, but almost all of that is in making the example table:
NamesDefaultToHere(1);

// Make a table with 'nc' columns and 'nr' rows to use . . .
nc = 1000;
nr = 57;
dt = NewTable("MAD Example");
for(c=1, c<=nc, c++,
	dt << NewColumn("Col "||Char(c), Numeric, Continuous, Formula(RandomNormal(0, 1)));
);
dt << addRows(nr);
dt << runFormulas;

// Start Here: Calculate MAD for each column . . .
dt = CurrentDataTable();
mat = dt << getAsMatrix;
// (1): Get the mean of each column in a row vector
mean = VMean(mat);
// (2): 'Explode' this to make a matrix congruant with 'mat'
meanMat = Repeat(mean, nr);
// (3): Get the Absolute deviations
AD = Abs(mat - meanMat);
// (4): Get the MAD
MAD = VMean(AD);
// Find the column numbers of the 'nc2' columns that have the biggest MAD values
nc2 = Round(nc/10, 0);
rankMAD = Rank(MAD);
topRandMAD = rankMAD[(nc-nc2)+1::nc];
// Make a second table
dt2 = NewTable("Top "||Char(nc2)||" Largest MAD Values from "||(dt << getName),
			NewColumn("Column Number", Numeric, Nominal, Values(topRandMAD)),
			NewColumn("MAD", Numeric, Continuous, Values(MAD[topRandMAD]))
			);
In addition to @txnelson approach, I note that the Distribution platform will give the median absolute deviation. With 800,000 columns I might expect his approach to be quicker though.
- Mark as New
- Bookmark
- Subscribe
- Mute
- Subscribe to RSS Feed
- Get Direct Link
- Report Inappropriate Content
Re: Median Absolute Deviation --> Export To Table for further tSNE
Recommended Articles
- © 2026 JMP Statistical Discovery LLC. All Rights Reserved.
- Terms of Use
- Privacy Statement
- Contact Us