- JMP will suspend normal business operations for our Winter Holiday beginning on Wednesday, Dec. 24, 2025, at 5:00 p.m. ET (2:00 p.m. ET for JMP Accounts Receivable).
Regular business hours will resume at 9:00 a.m. EST on Friday, Jan. 2, 2026. - We’re retiring the File Exchange at the end of this year. The JMP Marketplace is now your destination for add-ins and extensions.
- Subscribe to RSS Feed
- Mark Topic as New
- Mark Topic as Read
- Float this Topic for Current User
- Bookmark
- Subscribe
- Mute
- Printer Friendly Page
Discussions
Solve problems, and share tips and tricks with other JMP users.- JMP User Community
- :
- Discussions
- :
- Re: MANOVA vs Multiple Response ANOVA
- Mark as New
- Bookmark
- Subscribe
- Mute
- Subscribe to RSS Feed
- Get Direct Link
- Report Inappropriate Content
MANOVA vs Multiple Response ANOVA
Hi,
in the Fit Model dialog, you can fit multiple response variables (Y) and test the effect of multiple predictors. I have noticed that you can do this both using “Standard Least Square fitting” and choose to fit your responses together, or using a MANOVA. The results of the two approaches are quite different.
My question is, what is the difference of interpretation of the two models?
Thanks in advance for your answer.
- Mark as New
- Bookmark
- Subscribe
- Mute
- Subscribe to RSS Feed
- Get Direct Link
- Report Inappropriate Content
Re: MANOVA vs Multiple Response ANOVA
Hi @gchelini,
It may be hard to help you without a dataset and the results you obtained.
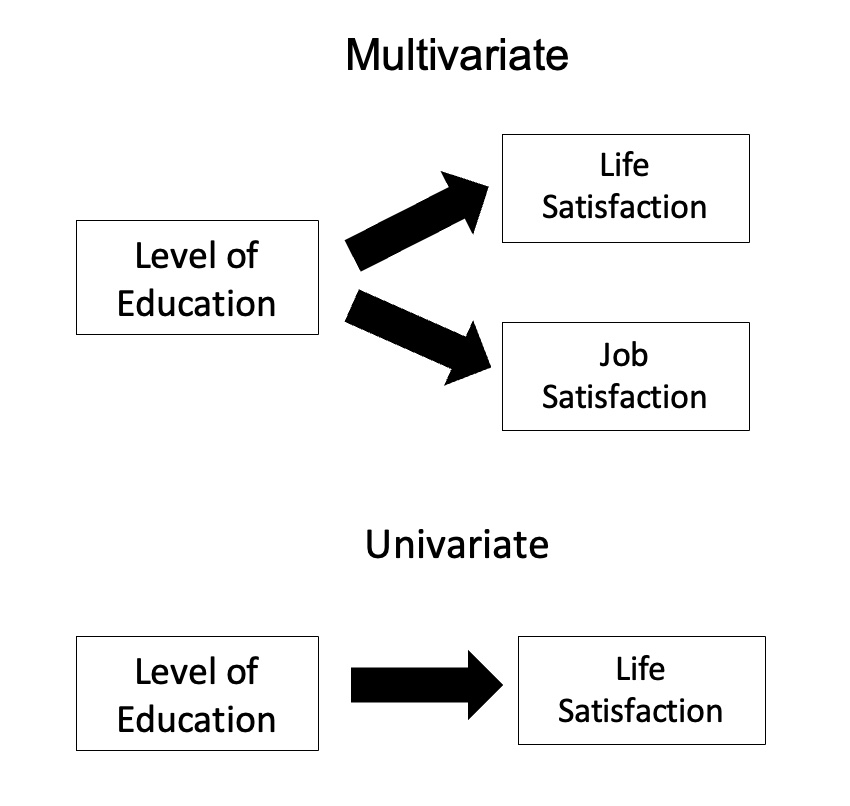
In a very theoritical way, the two approach are different, as MANOVA uses covariance between responses in testing the statistical significance of the mean differences. Standard Least Squares / standard ANOVA for multiple responses test mean differences for each response separately/independantly.
More info here : https://en.wikipedia.org/wiki/Multivariate_analysis_of_variance
The choice of one method over another depends mainly on your objective and the data collection process, as you can see that MANOVA analysis has several personality available depending on the data collection process (for example repeated measurements) : Additional Examples of the Manova Personality
Hope this will help you understand the main differences between methods,
"It is not unusual for a well-designed experiment to analyze itself" (Box, Hunter and Hunter)
- Mark as New
- Bookmark
- Subscribe
- Mute
- Subscribe to RSS Feed
- Get Direct Link
- Report Inappropriate Content
Re: MANOVA vs Multiple Response ANOVA
Thanks for your answer and the resources provided. I guess my question all comes down to how do I interpret this recap table (attached)? This appears only if I decide to fit all my Y variables together.
Is this providing me information about the factors that explain most of the common variance between my responses?
- Mark as New
- Bookmark
- Subscribe
- Mute
- Subscribe to RSS Feed
- Get Direct Link
- Report Inappropriate Content
Re: MANOVA vs Multiple Response ANOVA
Hi @gchelini
This report is available when you fit the same model to multiple responses : Fit Least Squares Report
The p-values for effects displayed here are the minimum p-values detected for one of the response.
As an example on the dataset "Exercise" from JMP :
- In Effect Summary (3 responses considered), factor waist has a p-value of 0,00917 :
- When you fit the responses separately, you will find that this p-value is the same as in the single report for response situps :
But you have a different p-values for the other 2 responses :
So the p-values display in an Effect Summary report for multiple responses is "conservative" in a sense that it will display the lowest p-value found for each effect for any of the responses considered (to prevent/avoid an "aggressive model refinement" or "accidental" removing of a term that is helpful in fitting one response, but not in the others).
But still, each response is fitted independantly/separately with the factors/terms, there is no use of covariance between responses as it can be done with MANOVA. This report can help you reduce the model if you see that a term has a high p-value in this report, as it will not be below this value when fitting the responses independantly.
Hope my answer is clear ?
"It is not unusual for a well-designed experiment to analyze itself" (Box, Hunter and Hunter)
Recommended Articles
- © 2026 JMP Statistical Discovery LLC. All Rights Reserved.
- Terms of Use
- Privacy Statement
- Contact Us


