- Instantly extract effect sizes, F-ratios, and FDR-adjusted p-values from your models with the Calculate Effects Sizes extension, available now in the JMP Marketplace!
- New to JMP? Join us Sept. 23-24 for the Early User Edition of Discovery Summit, tailor-made for new users. Register now for free!
- See how to use the JMP Marketplace – Free tools to expand JMP capabilities. Register. July 10, 2 pm US Eastern Time.
- Subscribe to RSS Feed
- Mark Topic as New
- Mark Topic as Read
- Float this Topic for Current User
- Bookmark
- Subscribe
- Mute
- Printer Friendly Page
Discussions
Solve problems, and share tips and tricks with other JMP users.- JMP User Community
- :
- Discussions
- :
- Looping x,y locations over time

- Mark as New
- Bookmark
- Subscribe
- Mute
- Subscribe to RSS Feed
- Get Direct Link
- Report Inappropriate Content
Looping x,y locations over time
Hello,
I'm fairly new to jmp (currently using jmp 16) and have a question about the following scenario. I have a csv file that has the following columns for each imperfection:
- Timestamp, serial ID, x location, y location, size of imperfection (in mm)
I work with a cleaning process and the inspection tool gives information for every single imperfection in the day. There are a couple of things I need to track:
1) number of times a particular serial ID has been processed and finding out if its the first time it has been cleaned, or second, third, etc.
2) if the serial ID has been cleaned more than once, then I need to know if any of combination of the (x,y) locations is still in the same spot after each cleaning
Graphing the x and y locations and then filtering by time I could get to answer 2) but its a very manual step. I am hoping to find a solution using jsl that could automate the information that I need to track.
- Tags:
- windows

- Mark as New
- Bookmark
- Subscribe
- Mute
- Subscribe to RSS Feed
- Get Direct Link
- Report Inappropriate Content
Re: Looping x,y locations over time
What sort of resolution do the x,y locations have? For example, they might always be integers from 1 to 100, or they might be floating point values from 0 to 100 that are rounded to the nearest .01 or they might be floats with no apparent limit to the resolution. How close would the x,y pair have to be to be a repeat? Does the size of the imperfection have anything to do with the x,y overlap? Or is the size always smaller than the x,y grid and ignored?
If there are only 100 x and 100 y values, and if the size is not interesting, then I'd combine the x and y values into a single key, x*100+y perhaps, that might make it easier to test for repeats. Maybe the same for rounded floats, up to about 6 significant digits.
But if the size matters, or the distances have to be tested, I might use a KDTable.
Also, how many rows? less than a few thousand probably wont need any particular optimization. More than a million probably will need a well thought out algorithm. (With under a thousand rows, every row can think about every other row and there is only 1,000,000 compares, but double the size and the compares quadruple.)
- Mark as New
- Bookmark
- Subscribe
- Mute
- Subscribe to RSS Feed
- Get Direct Link
- Report Inappropriate Content
Re: Looping x,y locations over time
Hello Craig
The x and y location go out 3 digits after the decimal point. As long as they are in within 3% of the same location it would be considered a repeat imperfection. The size does not have anything to do with the overlap. What has been done in the past is once its graphed the first loops get designated as a circle in one color and the second loops get an "x" in another color. Once they overlap its visually easy to see if its in the same location.
In terms of rows it could get into the several thousands depending on how much is ran on a day. its never crossed into millions although it a possibility if we look over a very long period at a time.

- Mark as New
- Bookmark
- Subscribe
- Mute
- Subscribe to RSS Feed
- Get Direct Link
- Report Inappropriate Content
Re: Looping x,y locations over time
Hi @SEG
1: try using the Table << summary platform. there, just put serial ID, x location and y location in the group.
this will give you a separate row for each unique combination of the three.
graphing this new summary table would be useful, just use the N column as color or size
2: once you produce a graph once, under the red triangle in top left you can choose to save the script to the data table or script window. jmp just wrote the script for you.
if you are using jmp 16 click view>>log and you will get a script of all you did in the current session.
let us know if it helps.
ron

- Mark as New
- Bookmark
- Subscribe
- Mute
- Subscribe to RSS Feed
- Get Direct Link
- Report Inappropriate Content
Re: Looping x,y locations over time
Hi,
Could you help us better understand your data structure by sharing an example (mock data would work fine)? Based on your description, I surmise that each cleaning event is identifiable by a unique combination of Timestamp and serial ID. Also, does your data include any replicate information (i.e., rows with an identical combination of Timestamp and serial ID? If it does, it will make the process more demanding. Finally, after identifying multiple cleaning events for a serial ID, are you interested in only capturing if the locations are identical across all events, identical between any two events, or something else?
Best,
TS
- Mark as New
- Bookmark
- Subscribe
- Mute
- Subscribe to RSS Feed
- Get Direct Link
- Report Inappropriate Content
Re: Looping x,y locations over time
Hello Thierry,
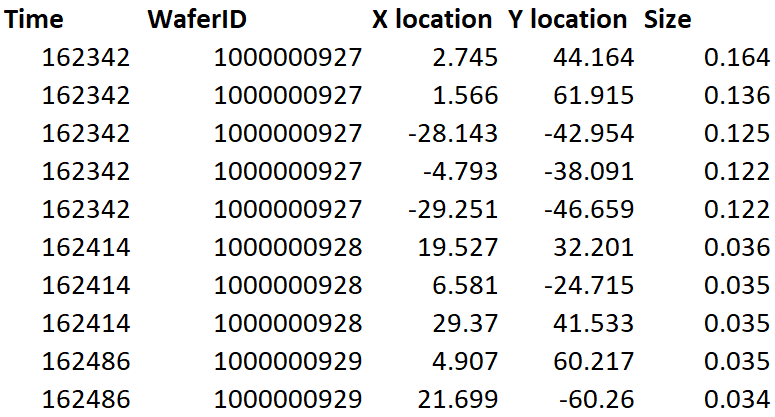
I attached a screenshot of the mock data. as you can see, each ID will get multiple hits at the same time stamp as all the imperfections get written at the same time, the main difference would be the x,y location and the size. Also note that this example is only of a first time cleaning. The second time, the same ID could appear with more or less rows and thats when I'd like to find if its repeating and also be able to identify that its a second, third, etc loops of cleaning.
After multiple cleanings for a serial numeber, I'd like to capture if the locations are identical across all events
- Mark as New
- Bookmark
- Subscribe
- Mute
- Subscribe to RSS Feed
- Get Direct Link
- Report Inappropriate Content
Re: Looping x,y locations over time
Here's some starter code. You'll need to study it to make sure it does what you expect. The output is in the Log window. (I'll attach a file. the code below might be messed up because the web site removed some "invalid html". )
// synthesize some data
radius = 1;

dt = New Table( "Untitled",
    Add Rows( 1000 ), // <<<<<<<<<<<<<< change number of rows here
    New Column( "time", Numeric, "Continuous", Format( "Best", 12 ) ),
    New Column( "waferID", Numeric, "Continuous", Format( "Best", 12 ) ),
    New Column( "xLocation", Numeric, "Continuous", Format( "Best", 12 ) ),
    New Column( "yLocation", Numeric, "Continuous", Format( "Best", 12 ) )
);
here:time = 0; // for this synth data, time just increments by 1
here:waferID = 0; // and the waferID is random 0-9
For( row = 1, row <= N Rows( dt ), row += 1,
    If( Random Uniform() > .8, // determines how many points in a cleaning, before time changes and wafer re-randomizes
        here:time += 1;
        here:waferID = Random Integer( 0, 9 );
    );
    dt:time[row] = here:time;
    dt:waferID[row] = here:waferID;
    dt:xLocation[row] = Round( Random Uniform( -radius, radius ), 2 );
    dt:yLocation[row] = Round( Random Uniform( -radius, radius ), 2 );
);


// find the unique waferIDs using summary
dtWafer = dt << Summary( Group( :waferID ), Link to original data table( 1 ) );
dtWaferTime = dt << Summary( Group( :waferID, :time ) );
dtNWafer = dtWaferTime << Summary( Group( :waferID ) ); //number of distinct times for this wafer is number of cleanings

close = .03; // <<< this determines how close makes a hit

// produce a report for each waferID that shows up in the cleaning data...
For( iWafer = 1, iWafer <= N Rows( dtWafer ), iWafer += 1,
    dtWafer << clear select << selectrows( iWafer ); // dtWafer selection also selects rows in dt because linked
    rows = dt << get selected rows; // all the rows for this wafer, across all times
    // rows is a 1-column matrix of row numbers in dt for this wafer. the argument to KDTable
    // is all the locations over all cleanings for this wafer.
    kdt = KDTable( dt[rows, {xLocation, yLocation}] );
    // report header for each waferID... the report might have no lines below the header, or a bunch... Not indented.
    Write( Eval Insert( "\!n\!nprocessing waferID=^dtWafer:waferID[iWafer]^, ^nrows(rows)^ points during ^dtNWafer:nrows[iWafer]^ cleanings" ) );
    For( irow = 1, irow <= N Rows( rows ), irow += 1, // the rows should be ascending time
        row = rows[irow]; // row (singular) is an index to dt
        // find rows {up to this many,up to this far} near irow
        {index, distance} = kdt << kNearestRows( {dtWafer:NRows[iWafer], close}, irow );
        // above, index is into the 1-column matrix of row numbers. below, it becomes index into dt
        index = rows[index];
        printedHeader = 0; // don't print this header unless there are duplicates to go with it
        // distance[] and index[] have same number of rows; index is indexes to near neighbors and distance is to the neighbor
        For( idistance = 1, idistance <= N Items( distance ), idistance += 1,
            If( dt:waferID[index[idistance]] != dt:waferID[row] | dt:waferID[row] != dtWafer:waferID[iWafer],
                Throw( "wafer mismatch" )
            );// sanity check
            If( distance[idistance] <= close, // typically there is one item with a bigger distance than we care about, must be ignored by else-break below.
                If( !printedHeader, // a little indented...
                    Write(
                        Eval Insert(
                            "\!n  matches for row ^row^ time ^dt:time[row]^ loc [^char(dt:xLocation[row],7,3)^,^char(dt:yLocation[row],7,3)^]"
                        )
                    );
                    printedHeader = 1;
                );
                // there can be more than one subsequent cleaning, indented more...
                Write( Eval Insert( "\!n              row ^index[idistance]^ time ^dt:time[index[idistance]]^ " ) );
                Write( Eval Insert( "[^char(dt:xLocation[index[idistance]],7,3)^,^char(dt:yLocation[index[idistance]],7,3)^]) " ) );
                Write( Eval Insert( "dist(^distance[idistance]^)" ) );
            , //else
                Break()
            );
        );
        kdt << removerows( irow ); // never look back at this row from future rows
    );
);

// a graph to examine the rows found to be close.
dt << Graph Builder(
    Size( 867, 787 ),
    Show Control Panel( 0 ),
    Variables( X( :xLocation ), Y( :yLocation ) ),
    Elements( Points( X, Y, Legend( 5 ) ) ),
    Local Data Filter( Add Filter( columns( :waferID ), Modeling Type( :waferID, Nominal ), Display( :waferID, N Items( 14 ) ) ) )
);

- Mark as New
- Bookmark
- Subscribe
- Mute
- Subscribe to RSS Feed
- Get Direct Link
- Report Inappropriate Content
Re: Looping x,y locations over time
I like Craige_Hales solution, but I also want to provide my solution as I have been faced with similar tasks in the past.
My approach was to use the available data to calculate additional information, add this to the data table, and then I was able to generate reports (graph builder, tabulate, etc) that showed the final results.
In your request, you want be be able to calculate the number of times a particular serial ID has been processed. I have also found it very useful to create an indicator column that identifies data entries from the last/final processing of a wafer.
Based on the example data from "mock data.PNG", I would do the following:
- calculate the sequential number for each time a wafer has been processed
- calculate the final time each wafer was processed
- identify defect locations by name based on approximate locations
- calculate the number of times each location name has been identified for each wafer
To accomplish this I generate several temporary data tables using tabulate, add some formulas to get the answers I want, and then merge them back into the original data table.
The JSL code would look something like this
names default to here(1);
/////////// make example data table /////////////////////
dt = New Table( "example data set",
	Add Rows( 13 ),
	New Column( "Time",
		Numeric,
		"Nominal",
		Format( "Best", 12 ),
		Set Values( [1, 1, 1, 1, 1, 2, 2, 2, 3, 3, 4, 4, 4] )
	),
	New Column( "WaferID",
		Numeric,
		"Nominal",
		Format( "Best", 12 ),
		Set Values( [1, 1, 1, 1, 1, 2, 2, 2, 3, 3, 1, 1, 1] )
	),
	New Column( "X location",
		Numeric,
		continuous,
		Format( "Best", 12 ),
		Set Values(
			[2.745, 1.566, -28.143, -4.793, -29.251, 19.527, 6.581, 29.37, 4.907,
			21.699, 2.745, -4.793, 6.581]
		)
	),
	New Column( "Y location",
		Numeric,
		continuous,
		Format( "Best", 12 ),
		Set Values(
			[44.164, 61.915, -42.954, -38.091, -46.659, 32.201, -24.715, 41.533,
			60.217, -60.26, 44.164, -38.091, -24.715]
		)
	),
	New Column( "Size",
		Numeric,
		"Continuous",
		Format( "Best", 12 ),
		Set Values(
			[0.164, 0.136, 0.125, 0.122, 0.122, 0.036, 0.035, 0.035, 0.035, 0.034,
			0.164, 0.122, 0.035]
		)
	)
);
//dt = current data table();

/////////// create temporary data table to determine Clean Count and Final Clean /////////////////
tab = dt << Tabulate(
	Show Control Panel( 0 ),
	Full Path Column Name( 1 ),
	Add Table( Row Table( Grouping Columns( :WaferID, :Time ) ) )
);
dtx = tab << make into data table();
tab << close window();
dtx << New Column("Wafer Clean Count", Numeric, "Nominal", Formula(Col Rank(:Time, :WaferID)));
dtx << New Column("Final Wafer Clean", Numeric, "Nominal", Formula(If(:Time == Col Maximum(:Time, :WaferID), 1, 0)));
dtx << delete Column("N");
///////// move Clean Count and Final Clean information back to original data table //////////////
dt << Update(
	With( dtx ),
	Match Columns( :WaferID = :WaferID, :Time = :Time ),
	Add Columns from Update Table( :Wafer Clean Count, :Final Wafer Clean ),
	Replace Columns in Main Table( :Wafer Clean Count, :Final Wafer Clean )
);
//////// close data table //////////////////////////////////////////////////////
close(dtx, no save);
//////// modify X & Y values to allow variation in measurements////////////////
dt << new column("X_Temp", numeric, continuous, formula(round(:X location, 1)));
dt << new column("Y_Temp", numeric, continuous, formula(round(:Y location, 1)));
/////// create temporary data table to name defect locations ///////////////
tab = dt << Tabulate(
	Show Control Panel( 0 ),
	Include missing for grouping columns( 1 ),
	Full Path Column Name( 1 ),
	Add Table( Row Table( Grouping Columns( :X_Temp, :Y_Temp ) ) )
);
dtx = tab << make into data table();
tab << close window();
dtx << new column("Location", character, nominal, formula("L" || char(row())));
dtx << delete column("N");
//////// move Location information back to original data table ////////////////
dt << Update(
	With( dtx ),
	Match Columns( :X_Temp = :X_Temp, :Y_Temp = :Y_Temp ),
	Add Columns from Update Table( :Location ),
	Replace Columns in Main Table( :Location )
);
/////// clean up /////////////////////////
close(dtx, no save);
dt << delete columns(
	{
		"X_Temp",
		"Y_Temp"
	}
);
/////// calculate the number of times a defect location occured on a given wafer ////////
dt << new column("Wafer Location Count", numeric, nominal, formula(Col Rank( :Time, :Location, :WaferID )));


/////// make some reports /////////////
nw = new window("results",
	h list box(
		gb = dt << Graph Builder(
			Show Control Panel( 0 ),
			Variables(
				X( :X location ),
				Y( :Y location ),
				Group X( :Wafer Clean Count ),
				Group Y( :WaferID ),
				Color( :Wafer Location Count )
			),
			Elements( Points( X, Y, Legend( 7 ) ) )
		),
		tab = dt << Tabulate(
			Show Control Panel( 0 ),
			Include missing for grouping columns( 1 ),
			Full Path Column Name( 1 ),
			Add Table(
				Column Table( Statistics( Max ), Analysis Columns( :Wafer Location Count ) ),
				Row Table( Grouping Columns( :WaferID, :X location, :Y location ) )
			),
			Local Data Filter(
				Add Filter(
					columns( :Final Wafer Clean ),
					Where( :Final Wafer Clean == 1 )
				)
			)
		)
	)
);
When naming the defect locations, I rounded the x coordinate and the y coordinate to one decimal place to allow for some variation in the position measurements. This may or may not be sufficient for your needs, but this approach allows you to modify the formula for X_Temp and Y_Temp and the rest will still work as expected.
The resulting data table contains the following additional columns:
- Wafer Clean Count
- contains the sequential number for the number of cleaning performed on the wafer
- Final Wafer Clean
- indicator column which is zero if the entry is not the final time the wafer was processed and a one if it is the final time the wafer was processed
- Location
- a name assigned to the approximate defect location
- Wafer Location Count
- contains the sequential number of times this defect location name has occurred on any given wafer
With the resulting data table, one would be able to address the questions you asked and more. Some of the possible questions that could be investigated include but are not limited to:
- which defect locations have persisted after multiple cleaning cycles
- what is the overall defect rate after the first wafer cleaning cycle
- what is the overall defect rate after all cleaning cycles have been performed
- what is the average number of cleaning cycles per wafer
- are there areas that consistently have defect areas that require cleaning
I hope this help.
- Mark as New
- Bookmark
- Subscribe
- Mute
- Subscribe to RSS Feed
- Get Direct Link
- Report Inappropriate Content
Re: Looping x,y locations over time
- Mark as New
- Bookmark
- Subscribe
- Mute
- Subscribe to RSS Feed
- Get Direct Link
- Report Inappropriate Content
Re: Looping x,y locations over time
@Craige_Hales I am definitely going to add KDTable() << kNearestRows( ) to my toolbox. I wasn't aware that this existed and am so happy to learn that it does.
Recommended Articles
- © 2026 JMP Statistical Discovery LLC. All Rights Reserved.
- Terms of Use
- Privacy Statement
- Contact Us