- Instantly extract effect sizes, F-ratios, and FDR-adjusted p-values from your models with the Calculate Effects Sizes extension, available now in the JMP Marketplace!
- New to JMP? Join us Sept. 23-24 for the Early User Edition of Discovery Summit, tailor-made for new users. Register now for free!
- See how to use the JMP Marketplace – Free tools to expand JMP capabilities. Register. July 10, 2 pm US Eastern Time.
- Subscribe to RSS Feed
- Mark Topic as New
- Mark Topic as Read
- Float this Topic for Current User
- Bookmark
- Subscribe
- Mute
- Printer Friendly Page
Discussions
Solve problems, and share tips and tricks with other JMP users.- JMP User Community
- :
- Discussions
- :
- Linear Regression

- Mark as New
- Bookmark
- Subscribe
- Mute
- Subscribe to RSS Feed
- Get Direct Link
- Report Inappropriate Content
Linear Regression
Hi,
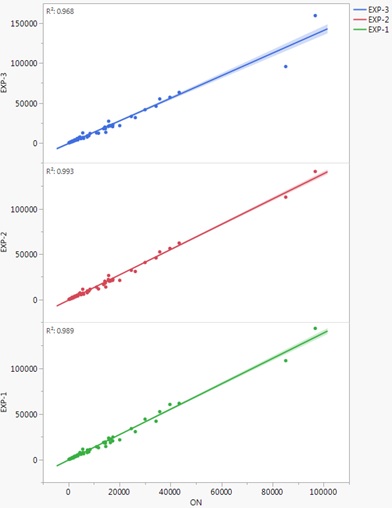
I want to show that two experimental conditions are the same using linear regression because one condition costs a lot more. When I plot x by y the Rsquared is very high (see pic). Each data point is a different sample (with expected vastly different responses), but the two conditions are the same sample measured at a different time.
However, I want to be as sure as possible when I claim that the two conditions are essentially the same to save on cost!
Is it good enough to say that the r2 is high and that means they are the same? Or should I be using some statistics from the fit x by y platform?
Any help appreciated!
Accepted Solutions

- Mark as New
- Bookmark
- Subscribe
- Mute
- Subscribe to RSS Feed
- Get Direct Link
- Report Inappropriate Content
Re: Linear Regression
R square is not specific for your purpose. For example, if you add one million to every result from one condition, you won't change R square but obviously the results are very different!
You likely want to use a hypothesis test to decide if the different conditions produce the same result. Unfortunately, these tests are usually taught and implemented to test a difference, not equivalence. In all cases, we assume that the null hypothesis is true unless the probability of a sample statistic at least as extreme as our result is so low that we reject the null and accept the alternative. So we usually assume that there is no difference, collect our sample, compute the sample statistic and its associated p-value and decide if there is a difference (in favor of the alternative).
You need to reverse the two hypotheses for your purpose: the null hypothesis is that there is a different result from the different conditions and reject that idea in favor of the alternative, which is that they are equivalent, if the p-value is sufficiently low. You actually need to use two one-sided t-tests (TOST). If you want to base it on regression, then you might consider the slope and the intercept as your sample statistics.
You must quantitatively define what you mean by 'equivalent.' That is, what range of values are practically equivalent. Consider the slope. A slope of 1 indicates that the linear relationship is identical. What if it is only 0.99 or 1.02? Is that difference significant to you? Let's say that you consider any slope between 0.95 and 1.05 to indicate that the linear relationship is practically the same for the rest of my reply. You must now demonstrate that the slope is simultaneously and statistically significantly greater than 0.95 and less than 1.05 using TOST.
JMP does not compute this result for you directly, but it comes close. The Parameter Estimates report provides the estimate and the standard error of the estimate. The t ratio reported here is for the hypothesis test of a difference from zero, so this statistic is not what you need. Set it up as TOST instead:
- Set up the upper one-tailed t-test for (estimate - 0.95) / standard error.
- Set up the lower one-tailed t-test for (estimate - 1.05) / standard error.
Both of these tests must be significant at the chosen level of significance (alpha).
You can use this script to Test for Parameter Equivalence to help, along with the written instructions, with your regression results.

- Mark as New
- Bookmark
- Subscribe
- Mute
- Subscribe to RSS Feed
- Get Direct Link
- Report Inappropriate Content
Re: Linear Regression
Most statistical techniques are not really designed to show "equality". The idea behind hypothesis testing is to show differences. Remember that not getting a statistically significant result does not mean that you have equality (we don't accept the null hypothesis for this reason). What you need to consider is looking at "Equivalence Testing". Do a search in the JMP help to see how this approach can work. You might need to change how you are looking at the problem.
- Mark as New
- Bookmark
- Subscribe
- Mute
- Subscribe to RSS Feed
- Get Direct Link
- Report Inappropriate Content
Re: Linear Regression
R square is not specific for your purpose. For example, if you add one million to every result from one condition, you won't change R square but obviously the results are very different!
You likely want to use a hypothesis test to decide if the different conditions produce the same result. Unfortunately, these tests are usually taught and implemented to test a difference, not equivalence. In all cases, we assume that the null hypothesis is true unless the probability of a sample statistic at least as extreme as our result is so low that we reject the null and accept the alternative. So we usually assume that there is no difference, collect our sample, compute the sample statistic and its associated p-value and decide if there is a difference (in favor of the alternative).
You need to reverse the two hypotheses for your purpose: the null hypothesis is that there is a different result from the different conditions and reject that idea in favor of the alternative, which is that they are equivalent, if the p-value is sufficiently low. You actually need to use two one-sided t-tests (TOST). If you want to base it on regression, then you might consider the slope and the intercept as your sample statistics.
You must quantitatively define what you mean by 'equivalent.' That is, what range of values are practically equivalent. Consider the slope. A slope of 1 indicates that the linear relationship is identical. What if it is only 0.99 or 1.02? Is that difference significant to you? Let's say that you consider any slope between 0.95 and 1.05 to indicate that the linear relationship is practically the same for the rest of my reply. You must now demonstrate that the slope is simultaneously and statistically significantly greater than 0.95 and less than 1.05 using TOST.
JMP does not compute this result for you directly, but it comes close. The Parameter Estimates report provides the estimate and the standard error of the estimate. The t ratio reported here is for the hypothesis test of a difference from zero, so this statistic is not what you need. Set it up as TOST instead:
- Set up the upper one-tailed t-test for (estimate - 0.95) / standard error.
- Set up the lower one-tailed t-test for (estimate - 1.05) / standard error.
Both of these tests must be significant at the chosen level of significance (alpha).
You can use this script to Test for Parameter Equivalence to help, along with the written instructions, with your regression results.
- Mark as New
- Bookmark
- Subscribe
- Mute
- Subscribe to RSS Feed
- Get Direct Link
- Report Inappropriate Content
Re: Linear Regression
Most statistical techniques are not really designed to show "equality". The idea behind hypothesis testing is to show differences. Remember that not getting a statistically significant result does not mean that you have equality (we don't accept the null hypothesis for this reason). What you need to consider is looking at "Equivalence Testing". Do a search in the JMP help to see how this approach can work. You might need to change how you are looking at the problem.
Recommended Articles
- © 2026 JMP Statistical Discovery LLC. All Rights Reserved.
- Terms of Use
- Privacy Statement
- Contact Us