- New to JMP? Join us Sept. 23-24 for the Early User Edition of Discovery Summit, tailor-made for new users. Register now for free!
- Use World Cup data to build models, explore spatial relationships, and create informative visualizations in JMP. Register. July 17, 2 pm US Eastern Time.
- Your voice matters! Tell us how you prefer to receive JMP updates, so we can tailor our communication to your needs. Take short survey.
- Subscribe to RSS Feed
- Mark Topic as New
- Mark Topic as Read
- Float this Topic for Current User
- Bookmark
- Subscribe
- Mute
- Printer Friendly Page
Discussions
Solve problems, and share tips and tricks with other JMP users.- JMP User Community
- :
- Discussions
- :
- Re: [JSL] Script for Two-One Side T-Test on a large number of metrics

- Mark as New
- Bookmark
- Subscribe
- Mute
- Subscribe to RSS Feed
- Get Direct Link
- Report Inappropriate Content
[JSL] Script for Two-One Side T-Test on a large number of metrics
Hello All,
I would like to write a JSL script to automate a TOST (Two-One Side T-Test) on a large number of metrics (500+).
The TOST works by pair of “levels”, so working with 2x levels is easy, because it requires only 1x row per “pair”.
I already wrote a script that works well for 2x levels by generating a “Combined data table” and adding more columns with formula to it, which end up with the results: “Equivalent” or “Not Equivalent”.
The problem thickens when I want to work with more than 2x Levels, it would require to find all possible unique pairs of “Levels” and then run the TOST math for every combination of Metric + pairs of Levels.
I found a way (on this forum) to find all possible unique pairs from a list and put them in a table or in a nested list (NchooseKmatrix()).
But I am stuck there. What I need is:
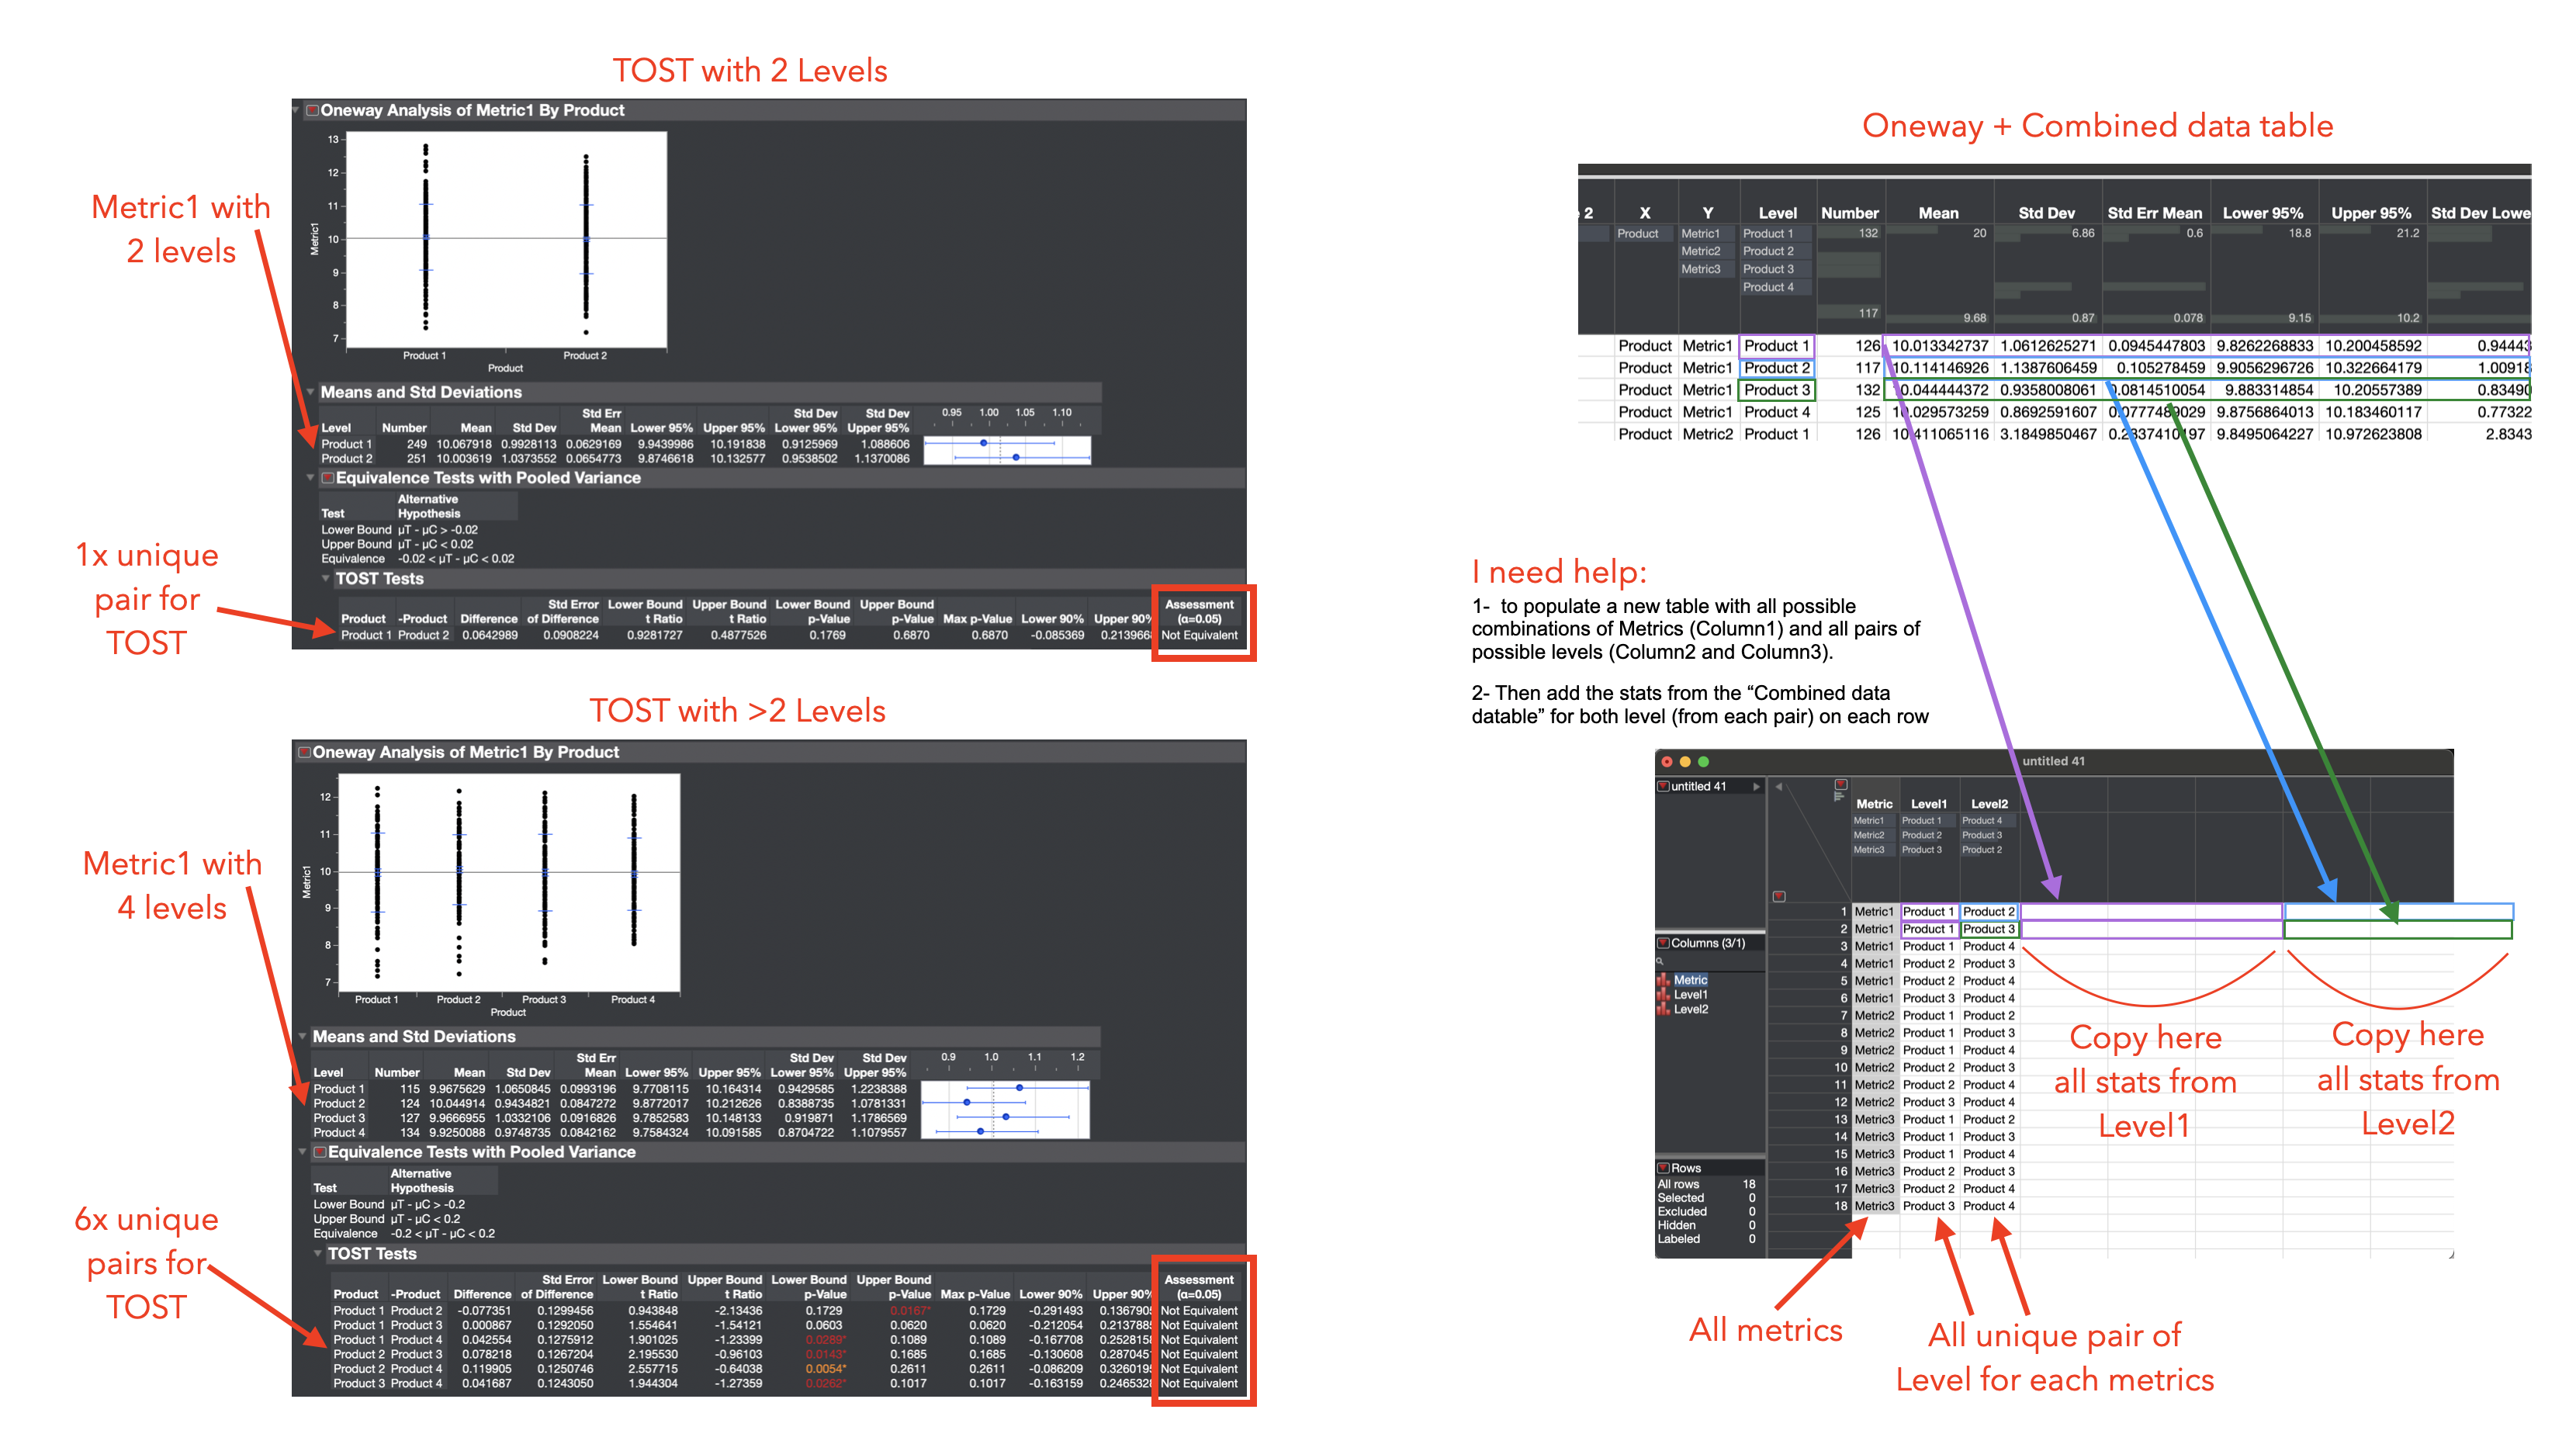
1- to populate a new table with all possible combinations of Metrics (Column1) and all pairs of possible levels (Column2 and Column3).
2- Then add the stats for each pair of level on each row
From this point I will be able to figure out the math to finalize the TOST.
I have attached a script that generates a dummy table, then a combined data table from the Oneway analysis, then my unsuccessful attempt of creating a third table with all combinations of Metrics + Unique pairs of level
Thanks in advance for your help
Names Default To Here( 1 );
clear symbols();
Deletesymbols();

//Create table with random distribution (table 1)
dt = New Table( "tabletest",
	Add Rows( 500 ),
	New Column( "Product", Character, "Nominal", formula("Product " ||char( Random Integer( 1, 4 )))),
	New Column( "Metric1", Numeric, "Continuous", formula( Random Normal( 10, 1 ) ) ),
	New Column( "Metric2", Numeric, "Continuous", formula( Random Gamma( 10, 1 ) ) ),
	New Column( "Metric3", Numeric, "Continuous", formula( Random Gamma( 10, 2 ) ) )


);
Column( dt, "Metric1" ) << set property( "spec limits", {LSL( 5 ), USL( 25 ), Show Limits( 0 )} );
Column( dt, "Metric2" ) << set property( "spec limits", {LSL( 0 ), USL( 40 ), Show Limits( 0 )} );
Column( dt, "Metric3" ) << set property( "spec limits", {LSL( 5 ), USL( 40 ), Show Limits( 0 )} );

dt << save( "$Desktop\tabletest.jmp" );

//Get a list from all unique Product

SplitBy = "Product";
summarize(ColumnSplitBy=by(Column (SplitBy)));
show(ColumnSplitBy);
For( i = N Items( ColumnSplitBy ), i > 0, i--,
  If( ColumnSplitBy[i] == "",
  Remove From( ColumnSplitBy, i, 1 );
  )
);

//Get Column name
MetricCols = dt << Get Column Names( numeric, continuous, "string" );

//Get all unique combo of 2 Products
ColumnSplitByCombo = aslist( nchoosekMatrix(nitems(ColumnSplitBy), 2));
show (ColumnSplitByCombo);


//Create a combinaed datatable with stats (Table 2)
ow = dt << Oneway(
	Y(Eval(MetricCols)),
	X(Eval(SplitBy)),
	Means and Std Dev(1),
	SendToReport(
		Dispatch(
			{"Means and Std Deviations"},
			"Std Dev Lower 95%",
			NumberColBox,
			{Visibility("Visible")}
		),
		Dispatch(
			{"Means and Std Deviations"},
			"Std Dev Upper 95%",
			NumberColBox,
			{Visibility("Visible")}
		)
	),
	Invisible
);

tb = Report(ow[1])[Outline Box("Means and Std Deviations"), Table Box(1)];
dt2 = tb << Make Combined Data Table;
tb << close window;

//Create new table for the result, each row has a unique pair of Levels
dt3 = astable( nchoosekMatrix(nitems(ColumnSplitBy), 2), << column names({"x", "y"}) );
dt3 << new column ("first", character, << set values ( ColumnSplitBy[dt3:x << get values]));
dt3 << new column ("second", character, << set values ( ColumnSplitBy[dt3:y << get values]));
dt3 << delete columns (1::2);

//Create a nested list with each pair of levels
Listdt3 = aslist( nchoosekMatrix(nitems(ColumnSplitBy), 2));
show (Listdt3);

// I tried to use associate array() to match the level and name but couldn't make it work
-Voiz
Accepted Solutions

- Mark as New
- Bookmark
- Subscribe
- Mute
- Subscribe to RSS Feed
- Get Direct Link
- Report Inappropriate Content
Re: [JSL] Script for Two-One Side T-Test on a large number of metrics
I would most likely use loops myself, but you can do it with some matrix operations. This script would require a rewrite to make it easier to read in my opinion (better named variables, utilizing Output table name, closing unnecessary tables and general cleanup)
Names Default To Here(1);

//Create table with random distribution (table 1)
dt = New Table("tabletest",
	Add Rows(5000),
	New Column("Product",
		Character,
		"Nominal",
		formula("Product " || Char(Random Integer(1, 4)))
	),
	New Column("Metric1", Numeric, "Continuous", formula(Random Normal(10, 1))),
	New Column("Metric2", Numeric, "Continuous", formula(Random Gamma(10, 1))),
	New Column("Metric3", Numeric, "Continuous", formula(Random Gamma(10, 2))),

);
Column(dt, "Metric1") << set property("spec limits", {LSL(5), USL(25), Show Limits(0)});
Column(dt, "Metric2") << set property("spec limits", {LSL(0), USL(40), Show Limits(0)});
Column(dt, "Metric3") << set property("spec limits", {LSL(5), USL(40), Show Limits(0)});


SplitBy = "Product";
Summarize(ColumnSplitBy = by(Column(SplitBy)));

MetricCols = dt << Get Column Names(numeric, continuous, "string");

ColumnSplitByCombo = As List(NChooseK Matrix(N Items(ColumnSplitBy), 2));


//Create a combinaed datatable with stats (Table 2)
ow = dt << Oneway(
	Y(Eval(MetricCols)),
	X(Eval(SplitBy)),
	Means and Std Dev(1),
	SendToReport(
		Dispatch({"Means and Std Deviations"}, "Std Dev Lower 95%", NumberColBox,
			{Visibility("Visible")}
		),
		Dispatch({"Means and Std Deviations"}, "Std Dev Upper 95%", NumberColBox,
			{Visibility("Visible")}
		)
	),
	Invisible
);

tb = Report(ow[1])[Outline Box("Means and Std Deviations"), Table Box(1)];
dt2 = tb << Make Combined Data Table;
tb << close window;

//Create a nested list with each pair of levels
Listdt3 = As List(NChooseK Matrix(N Items(ColumnSplitBy), 2));

mcols = N Items(MetricCols);
l = Repeat(Listdt3, mcols);
m = J(N Items(l) / mcols, mcols) :* (1::mcols);
mfinal = Sort Ascending(Shape(m, 1, N Items(l)));

dt3 = As Table(Matrix(l), <<column names({"x", "y"}));
dt3 << New Column("metric", Character, Values(MetricCols[mfinal]));
dt3 << New Column("first", character, <<set values(ColumnSplitBy[dt3:x << get values]));
dt3 << New Column("second", character, <<set values(ColumnSplitBy[dt3:y << get values]));
dt3 << New Column("R", Numeric, Ordinal, Values(1::N Items(l)));

dt4 = dt3 << Stack(
	columns(:first, :second),
	Source Label Column("Label"),
	Stacked Data Column("Data"),
	"Non-stacked columns"n(Keep(:Metric, :R))
);

Close(dt3, no save);


dt4 << Update(
	With(dt2),
	Match Columns(:metric = :Y, :Data = :Level)
);

dt_split = dt4 << Split(
	Split By(:Label),
	Split(
		:Metric, :Data, :Number, :Mean, :Std Dev, :Std Err Mean, :Lower 95%, :Upper 95%,
		:Std Dev Lower 95%, :Std Dev Upper 95%
	),
	Output Table("untitled 19.jmp"),
	Remaining Columns(Drop All),
	Sort by Column Property
);


- Mark as New
- Bookmark
- Subscribe
- Mute
- Subscribe to RSS Feed
- Get Direct Link
- Report Inappropriate Content
Re: [JSL] Script for Two-One Side T-Test on a large number of metrics
I attached a document "Untitled.png" with screenshots to (hopefully) better explain my request.
Thanks!
- Mark as New
- Bookmark
- Subscribe
- Mute
- Subscribe to RSS Feed
- Get Direct Link
- Report Inappropriate Content
Re: [JSL] Script for Two-One Side T-Test on a large number of metrics
You could for example first stack your group column, update it with the results and split it again.
This example doesn't take into account that there can be multiple Metrics
// Loop over Metrics and perform these for each of them
// Concatenate results into single table
dt3 = As Table(NChooseK Matrix(N Items(ColumnSplitBy), 2), <<column names({"x", "y"}));
dt3 << New Column("first", character, <<set values(ColumnSplitBy[dt3:x << get values]));
dt3 << New Column("second", character, <<set values(ColumnSplitBy[dt3:y << get values]));
dt3 << new column("R", Numeric, Ordinal, Formula(Row()));
dt4 = dt3 << Stack(
	columns(:first, :second),
	Source Label Column("Label"),
	Stacked Data Column("Data"),
	"Non-stacked columns"n(Keep(:R)),
);
close(dt3, no save);
// Metrics should be taken into account here OR stacked table should contain them
dt4 << Update(
	With(dt2),
	Match Columns(:Data = :Level)
);
or doesn't have the final split which most likely looks something like this

- Mark as New
- Bookmark
- Subscribe
- Mute
- Subscribe to RSS Feed
- Get Direct Link
- Report Inappropriate Content
Re: [JSL] Script for Two-One Side T-Test on a large number of metrics
Hello Jarmo,
Stack > Update > Split is a great idea!!!
I have been able to implement it successfully, but my code is a bit dirty (a lot of For() loops, intermediate steps,...).
Instead of:
- Concatenate the table multiple times
- Then populating a column from a list of repeated metrics
I would like to become better in optimizing my code.
Is there a way to populate dt5 in a more cleaner/optimized way? (use native JMP commands maybe?)
I would love your suggestions on this
But anyway, thanks a lot for helping me on this :D
-Voiz
Names Default To Here( 1 );
clear symbols();
Deletesymbols();

//Create table with random distribution (table 1)
dt = New Table( "tabletest",
	Add Rows( 5000 ),
	New Column( "Product", Character, "Nominal", formula("Product " ||char( Random Integer( 1, 4 )))),
	New Column( "Metric1", Numeric, "Continuous", formula( Random Normal( 10, 1 ) ) ),
	New Column( "Metric2", Numeric, "Continuous", formula( Random Gamma( 10, 1 ) ) ),
	New Column( "Metric3", Numeric, "Continuous", formula( Random Gamma( 10, 2 ) ) ),

);
Column( dt, "Metric1" ) << set property( "spec limits", {LSL( 5 ), USL( 25 ), Show Limits( 0 )} );
Column( dt, "Metric2" ) << set property( "spec limits", {LSL( 0 ), USL( 40 ), Show Limits( 0 )} );
Column( dt, "Metric3" ) << set property( "spec limits", {LSL( 5 ), USL( 40 ), Show Limits( 0 )} );

dt << save( "$Desktop\tabletest.jmp" );

//Get a list from all unique Product

SplitBy = "Product";
summarize(ColumnSplitBy=by(Column (SplitBy)));
show(ColumnSplitBy);
For( i = N Items( ColumnSplitBy ), i > 0, i--,
  If( ColumnSplitBy[i] == "",
  Remove From( ColumnSplitBy, i, 1 );
  )
);

//Get Column name
MetricCols = dt << Get Column Names( numeric, continuous, "string" );
show(MetricCols);

//Get all unique combo of 2 Products
ColumnSplitByCombo = aslist( nchoosekMatrix(nitems(ColumnSplitBy), 2));
show (ColumnSplitByCombo);


//Create a combinaed datatable with stats (Table 2)
ow = dt << Oneway(
	Y(Eval(MetricCols)),
	X(Eval(SplitBy)),
	Means and Std Dev(1),
	SendToReport(
		Dispatch(
			{"Means and Std Deviations"},
			"Std Dev Lower 95%",
			NumberColBox,
			{Visibility("Visible")}
		),
		Dispatch(
			{"Means and Std Deviations"},
			"Std Dev Upper 95%",
			NumberColBox,
			{Visibility("Visible")}
		)
	),
	Invisible
);

tb = Report(ow[1])[Outline Box("Means and Std Deviations"), Table Box(1)];
dt2 = tb << Make Combined Data Table;
tb << close window;


//Create new table for the result, each row has a unique pair of Levels
dt3 = astable( nchoosekMatrix(nitems(ColumnSplitBy), 2), << column names({"x", "y"}) );
dt3 << new column ("first", character, << set values ( ColumnSplitBy[dt3:x << get values]));
dt3 << new column ("second", character, << set values ( ColumnSplitBy[dt3:y << get values]));
dt3 << delete columns (1::2);

//Create a nested list with each pair of levels
Listdt3 = aslist( nchoosekMatrix(nitems(ColumnSplitBy), 2));
show (Listdt3);

// I tried to use associate array() to match the level and name but couldn't make it work

// Loop over Metrics and perform these for each of them
// Concatenate results into single table
dt3 = As Table(NChooseK Matrix(N Items(ColumnSplitBy), 2), <<column names({"x", "y"}));
dt3 << New Column("first", character, <<set values(ColumnSplitBy[dt3:x << get values]));
dt3 << New Column("second", character, <<set values(ColumnSplitBy[dt3:y << get values]));
dt3 << new column("R", Numeric, Ordinal, Formula(Row()));
dt4 = dt3 << Stack(
	columns(:first, :second),
	Source Label Column("Label"),
	Stacked Data Column("Data"),
	"Non-stacked columns"n(Keep(:R)),
);
close(dt3, no save);

// create final table
dt5 = New Table("final",
	New Column( "R", Character, "Nominal"),
	New Column( "Label", Character, "Nominal"),
	New Column( "Data", Character, "Nominal")
);

// create the Metric list to populate into dt5 metric column <-- not very clean
MetricListFinal = {};
For (k=1, k<=N items(MetricCols), k++,
	For(j=1, j<=N rows(dt4), j++,
		Insert into(MetricListFinal, MetricCols[k]);
));
show(MetricListFinal);

// concatenate the stacked list of unique pairs of level <-- not very clean
For(i=1, i<=N items(MetricCols), i++,
	dt5 << concatenate(data table(dt4), append to first table(1));
);

// populate the column with the list of metrics <-- not very clean
dt5 << New Column( "Metric", Character, "Nominal", values(MetricListFinal));

// update table from Combined stats table
dt5 << Update(
	With(dt2),
	Match Columns(:Data = :Level, :Metric = :Y )
);

// split table by level
dt5 << Split(
	Split By( :Label ),
	Split(
		:Metric, :Data, :Number, :Mean, :Std Dev, :Std Err Mean, :Lower 95%,
		:Upper 95%, :Std Dev Lower 95%, :Std Dev Upper 95%
	),
	Output Table( "untitled 19.jmp" ),
	Remaining Columns( Drop All ),
	Sort by Column Property
);- Mark as New
- Bookmark
- Subscribe
- Mute
- Subscribe to RSS Feed
- Get Direct Link
- Report Inappropriate Content
Re: [JSL] Script for Two-One Side T-Test on a large number of metrics
I would most likely use loops myself, but you can do it with some matrix operations. This script would require a rewrite to make it easier to read in my opinion (better named variables, utilizing Output table name, closing unnecessary tables and general cleanup)
Names Default To Here(1);

//Create table with random distribution (table 1)
dt = New Table("tabletest",
	Add Rows(5000),
	New Column("Product",
		Character,
		"Nominal",
		formula("Product " || Char(Random Integer(1, 4)))
	),
	New Column("Metric1", Numeric, "Continuous", formula(Random Normal(10, 1))),
	New Column("Metric2", Numeric, "Continuous", formula(Random Gamma(10, 1))),
	New Column("Metric3", Numeric, "Continuous", formula(Random Gamma(10, 2))),

);
Column(dt, "Metric1") << set property("spec limits", {LSL(5), USL(25), Show Limits(0)});
Column(dt, "Metric2") << set property("spec limits", {LSL(0), USL(40), Show Limits(0)});
Column(dt, "Metric3") << set property("spec limits", {LSL(5), USL(40), Show Limits(0)});


SplitBy = "Product";
Summarize(ColumnSplitBy = by(Column(SplitBy)));

MetricCols = dt << Get Column Names(numeric, continuous, "string");

ColumnSplitByCombo = As List(NChooseK Matrix(N Items(ColumnSplitBy), 2));


//Create a combinaed datatable with stats (Table 2)
ow = dt << Oneway(
	Y(Eval(MetricCols)),
	X(Eval(SplitBy)),
	Means and Std Dev(1),
	SendToReport(
		Dispatch({"Means and Std Deviations"}, "Std Dev Lower 95%", NumberColBox,
			{Visibility("Visible")}
		),
		Dispatch({"Means and Std Deviations"}, "Std Dev Upper 95%", NumberColBox,
			{Visibility("Visible")}
		)
	),
	Invisible
);

tb = Report(ow[1])[Outline Box("Means and Std Deviations"), Table Box(1)];
dt2 = tb << Make Combined Data Table;
tb << close window;

//Create a nested list with each pair of levels
Listdt3 = As List(NChooseK Matrix(N Items(ColumnSplitBy), 2));

mcols = N Items(MetricCols);
l = Repeat(Listdt3, mcols);
m = J(N Items(l) / mcols, mcols) :* (1::mcols);
mfinal = Sort Ascending(Shape(m, 1, N Items(l)));

dt3 = As Table(Matrix(l), <<column names({"x", "y"}));
dt3 << New Column("metric", Character, Values(MetricCols[mfinal]));
dt3 << New Column("first", character, <<set values(ColumnSplitBy[dt3:x << get values]));
dt3 << New Column("second", character, <<set values(ColumnSplitBy[dt3:y << get values]));
dt3 << New Column("R", Numeric, Ordinal, Values(1::N Items(l)));

dt4 = dt3 << Stack(
	columns(:first, :second),
	Source Label Column("Label"),
	Stacked Data Column("Data"),
	"Non-stacked columns"n(Keep(:Metric, :R))
);

Close(dt3, no save);


dt4 << Update(
	With(dt2),
	Match Columns(:metric = :Y, :Data = :Level)
);

dt_split = dt4 << Split(
	Split By(:Label),
	Split(
		:Metric, :Data, :Number, :Mean, :Std Dev, :Std Err Mean, :Lower 95%, :Upper 95%,
		:Std Dev Lower 95%, :Std Dev Upper 95%
	),
	Output Table("untitled 19.jmp"),
	Remaining Columns(Drop All),
	Sort by Column Property
);
- Mark as New
- Bookmark
- Subscribe
- Mute
- Subscribe to RSS Feed
- Get Direct Link
- Report Inappropriate Content
Re: [JSL] Script for Two-One Side T-Test on a large number of metrics
Hey Jarmo,
Thanks for your quick response.
This line is failing
m = J(N Items(l) / mcols, mcols) (1::mcols);
Can you explain what it is intended to do?
I don't usually use Matrices, I tried to debug myself but couldn't...
Thanks for your help
- Mark as New
- Bookmark
- Subscribe
- Mute
- Subscribe to RSS Feed
- Get Direct Link
- Report Inappropriate Content
Re: [JSL] Script for Two-One Side T-Test on a large number of metrics
For some reason it is missing :*
m = J(N Items(l) / mcols, mcols) :* (1 :: mcols);Purpose is to create a matrix like this

which you then convert to

using Shape.
Also go with the loops, they are generally much easier to read and understand than weird matrix "tricks".
- Mark as New
- Bookmark
- Subscribe
- Mute
- Subscribe to RSS Feed
- Get Direct Link
- Report Inappropriate Content
Re: [JSL] Script for Two-One Side T-Test on a large number of metrics
Hi Jarmo,
I tested several versions of this line, adding special characters that could be lost in translation, but no...
This line doesn't work on my end (I am using JMP Pro 17)

That's OK, this optimization using Matrix is really nice to have. As you said, using loops also works so I will go with that :)
Thanks again for taking the time to help me (once again)!
:D
-Voiz
- Mark as New
- Bookmark
- Subscribe
- Mute
- Subscribe to RSS Feed
- Get Direct Link
- Report Inappropriate Content
Re: [JSL] Script for Two-One Side T-Test on a large number of metrics
I have attached the part of code which breaks in community as a screenshot

It is element-wise multiplication of matrices E Mult()
@Ryan_Gilmore JMP community is eating :* (: * added space here)
JSL code block:
m = J(N Items(l) / mcols, mcols) :* (1::mcols);Text:
m = J(N Items(l) / mcols, mcols) :* (1::mcols);
Screenshot of while editing

Screenshot from Preview


- Mark as New
- Bookmark
- Subscribe
- Mute
- Subscribe to RSS Feed
- Get Direct Link
- Report Inappropriate Content
Re: [JSL] Script for Two-One Side T-Test on a large number of metrics
Hi @Voizingu : The TOST is just checking to see if the 100(1-2alpha)% confidence interval is contained entirely within some equivalence limits; so, perhaps an adequate workaround would be to use the Fit Y by X multiple comparisons procedure to do all the combinations for you?
Recommended Articles
- © 2026 JMP Statistical Discovery LLC. All Rights Reserved.
- Terms of Use
- Privacy Statement
- Contact Us