Turn on suggestions
Auto-suggest helps you quickly narrow down your search results by suggesting possible matches as you type.
- Image to Table JMP extension imports single or batch images as data tables. Useful to extract curves from pictures or convert image data to curve data to use in analyses like Functional Data Explorer. Download and install the extension.
Options
- Subscribe to RSS Feed
- Mark Topic as New
- Mark Topic as Read
- Float this Topic for Current User
- Bookmark
- Subscribe
- Mute
- Printer Friendly Page
Discussions
Solve problems, and share tips and tricks with other JMP users.- User Community
- :
- Discussions
- :
- Re: [JSL] Local Data Filter Selection Not Being Applied When Generating Table of...

Level II
- Mark as New
- Bookmark
- Subscribe
- Mute
- Subscribe to RSS Feed
- Get Direct Link
- Report Inappropriate Content
[JSL] Local Data Filter Selection Not Being Applied When Generating Table of Graphs
Created:
Jul 7, 2020 10:51 PM
| Last Modified: Jun 9, 2023 4:31 PM
(3827 views)
Hello,
I am trying to create a table of histograms that have had a local data filter applied to only display a subset of the data. However, when I review the pictures in the table, the histograms are displaying plots for all available data. In the sample JSL below. I have used the Semiconductor Capability.jmp sample data file. For example, if the filter is being applied ( for lot_id = "lot09"), all measurements for the PNP5 column should be within spec limits. (I'm not sure if this is pertinent, but I am using JMP 14.3.0 on Windows 10).
Thanks,
AW
Names Default To Here( 1 );
dt = Open( "$SAMPLE_DATA/Semiconductor Capability.jmp" );

//************************************************************************************************************************************************************************************************************
// Set Graph Reference Limits
//***********************************************************************************************************************************************************************************************************
Wait( 0.5 );
Set_Graph_Lines = Manage Spec Limits( Y( dt << Get Column Group( "Processes" ) ) );
Set_Graph_Lines << Show Limits All( 1 );
Set_Graph_Lines << Save to Column Properties( 1 );

//************************************************************************************************************************************************************************************************************
// Generate Table of Histograms
//***********************************************************************************************************************************************************************************************************
HistPics = New Table( "Table of Histograms",
		New Column( "Histograms", Expression, "None", Set Values( {} ),Set Display Width( 300 ) ),
		New Column( "Parameter", Character, "Nominal", Set Values( {} ),Set Display Width( 200 ) ) );

// Generate List of Column Names as a list of Strings to Use as parameter column name in datatable cells
//----------------------------------------------------------------------------------------------------------
Cols_List_String = dt << Get Column Names( "String");
Cols_List_String_Cnt = N Items( Cols_List_String );

For( j = 1, j <= Cols_List_String_Cnt, j++,
	Gen_Distribution = dt << Distribution(
		Column( dt:j ),
		Quantiles( 0 ),
		Outlier Box Plot( 0 ),
		PpK Capability Labeling( 0 ),
		Capability Analysis (0),
		Frequencies(0),
		Summary Statistics(0),
		Local Data Filter(
			Grouped by AND( 1 ),
			Add Filter(
				columns( :lot_id ),
				Where( :lot_id == "lot09" ),
				Display( :lot_id, Size( 181, 136 ), List Display )))
	);
	pic = (Report( Gen_Distribution )) << getpicture;  //Neither local data filter selection nor spec limit reference lines are being captured
	Gen_Distribution << closewindow();
    ParmName = Cols_List_String[j];
	HistPics << addrows( 1 );
	HistPics:Histograms[j] = pic;
	HistPics:Parameter[j] = ParmName;
);
HistPics<<Set Cell Height( 165 );

Set_Graph_Lines  << Close Window;
1 ACCEPTED SOLUTION
Accepted Solutions
Level II
Solution
- Mark as New
- Bookmark
- Subscribe
- Mute
- Subscribe to RSS Feed
- Get Direct Link
- Report Inappropriate Content
Re: [JSL] Local Data Filter Selection Not Being Applied When Generating Table of Graphs
@martindemel Thank you for helping to dig into this issue. I ended up submitting a tech support ticket and, through a bit of experimentation, we figured out that if a wait(0) statement is inserted between the creation of the Distribution report and the GetPicture statement in my original code, the issue goes away (although there is a considerable slow down). The << Update Window command also corrects the issue, but does not cause the code execution slowdown the wait () statement. Thanks, AW
3 REPLIES 3


Staff
- Mark as New
- Bookmark
- Subscribe
- Mute
- Subscribe to RSS Feed
- Get Direct Link
- Report Inappropriate Content
Re: [JSL] Local Data Filter Selection Not Being Applied When Generating Table of Graphs
Hmm, when I run your script I get PNP5 within spec in the histogram:
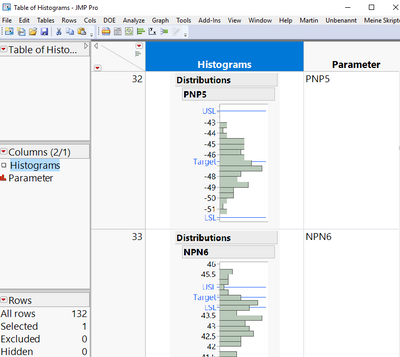
Can you show your results?, e.g. providing the resulting data table?
/****NeverStopLearning****/
Staff
- Mark as New
- Bookmark
- Subscribe
- Mute
- Subscribe to RSS Feed
- Get Direct Link
- Report Inappropriate Content
Re: [JSL] Local Data Filter Selection Not Being Applied When Generating Table of Graphs
I checked in 14.3 and I see what you mean. There might be a bug which has been fixed. Best to ask Tech Support for clarification.
([email protected]). My results shown above were done with JMP 15.1
([email protected]). My results shown above were done with JMP 15.1
/****NeverStopLearning****/
Level II
Solution
- Mark as New
- Bookmark
- Subscribe
- Mute
- Subscribe to RSS Feed
- Get Direct Link
- Report Inappropriate Content
Re: [JSL] Local Data Filter Selection Not Being Applied When Generating Table of Graphs
@martindemel Thank you for helping to dig into this issue. I ended up submitting a tech support ticket and, through a bit of experimentation, we figured out that if a wait(0) statement is inserted between the creation of the Distribution report and the GetPicture statement in my original code, the issue goes away (although there is a considerable slow down). The << Update Window command also corrects the issue, but does not cause the code execution slowdown the wait () statement. Thanks, AW
Recommended Articles
- © 2026 JMP Statistical Discovery LLC. All Rights Reserved.
- Terms of Use
- Privacy Statement
- Contact Us