Turn on suggestions
Auto-suggest helps you quickly narrow down your search results by suggesting possible matches as you type.
- Don’t miss your chance to experience Discovery Summit Europe at our best available rate! Early bird registration through 31 Oct.
- Graph Builder Toolbar streamlines interactive graphing. Creates shortcuts on Report and GraphBuilder Helpers toolbars. Download and install the extension.
Options
- Subscribe to RSS Feed
- Mark Topic as New
- Mark Topic as Read
- Float this Topic for Current User
- Bookmark
- Subscribe
- Mute
- Printer Friendly Page
Discussions
Solve problems, and share tips and tricks with other JMP users.- User Community
- :
- Discussions
- :
- Re: [JSL] Local Data Filter Selection Not Being Applied When Generating Table of...

Level II
- Mark as New
- Bookmark
- Subscribe
- Mute
- Subscribe to RSS Feed
- Get Direct Link
- Report Inappropriate Content
[JSL] Local Data Filter Selection Not Being Applied When Generating Table of Graphs
Created:
Jul 7, 2020 10:51 PM
| Last Modified: Jun 9, 2023 4:31 PM
(3789 views)
Hello,
I am trying to create a table of histograms that have had a local data filter applied to only display a subset of the data. However, when I review the pictures in the table, the histograms are displaying plots for all available data. In the sample JSL below. I have used the Semiconductor Capability.jmp sample data file. For example, if the filter is being applied ( for lot_id = "lot09"), all measurements for the PNP5 column should be within spec limits. (I'm not sure if this is pertinent, but I am using JMP 14.3.0 on Windows 10).
Thanks,
AW
Names Default To Here( 1 );
dt = Open( "$SAMPLE_DATA/Semiconductor Capability.jmp" );

//************************************************************************************************************************************************************************************************************
// Set Graph Reference Limits
//***********************************************************************************************************************************************************************************************************
Wait( 0.5 );
Set_Graph_Lines = Manage Spec Limits( Y( dt << Get Column Group( "Processes" ) ) );
Set_Graph_Lines << Show Limits All( 1 );
Set_Graph_Lines << Save to Column Properties( 1 );

//************************************************************************************************************************************************************************************************************
// Generate Table of Histograms
//***********************************************************************************************************************************************************************************************************
HistPics = New Table( "Table of Histograms",
		New Column( "Histograms", Expression, "None", Set Values( {} ),Set Display Width( 300 ) ),
		New Column( "Parameter", Character, "Nominal", Set Values( {} ),Set Display Width( 200 ) ) );

// Generate List of Column Names as a list of Strings to Use as parameter column name in datatable cells
//----------------------------------------------------------------------------------------------------------
Cols_List_String = dt << Get Column Names( "String");
Cols_List_String_Cnt = N Items( Cols_List_String );

For( j = 1, j <= Cols_List_String_Cnt, j++,
	Gen_Distribution = dt << Distribution(
		Column( dt:j ),
		Quantiles( 0 ),
		Outlier Box Plot( 0 ),
		PpK Capability Labeling( 0 ),
		Capability Analysis (0),
		Frequencies(0),
		Summary Statistics(0),
		Local Data Filter(
			Grouped by AND( 1 ),
			Add Filter(
				columns( :lot_id ),
				Where( :lot_id == "lot09" ),
				Display( :lot_id, Size( 181, 136 ), List Display )))
	);
	pic = (Report( Gen_Distribution )) << getpicture;  //Neither local data filter selection nor spec limit reference lines are being captured
	Gen_Distribution << closewindow();
    ParmName = Cols_List_String[j];
	HistPics << addrows( 1 );
	HistPics:Histograms[j] = pic;
	HistPics:Parameter[j] = ParmName;
);
HistPics<<Set Cell Height( 165 );

Set_Graph_Lines  << Close Window;
1 ACCEPTED SOLUTION
Accepted Solutions
Level II
Solution
- Mark as New
- Bookmark
- Subscribe
- Mute
- Subscribe to RSS Feed
- Get Direct Link
- Report Inappropriate Content
Re: [JSL] Local Data Filter Selection Not Being Applied When Generating Table of Graphs
@martindemel Thank you for helping to dig into this issue. I ended up submitting a tech support ticket and, through a bit of experimentation, we figured out that if a wait(0) statement is inserted between the creation of the Distribution report and the GetPicture statement in my original code, the issue goes away (although there is a considerable slow down). The << Update Window command also corrects the issue, but does not cause the code execution slowdown the wait () statement. Thanks, AW
3 REPLIES 3


Staff
- Mark as New
- Bookmark
- Subscribe
- Mute
- Subscribe to RSS Feed
- Get Direct Link
- Report Inappropriate Content
Re: [JSL] Local Data Filter Selection Not Being Applied When Generating Table of Graphs
Hmm, when I run your script I get PNP5 within spec in the histogram:
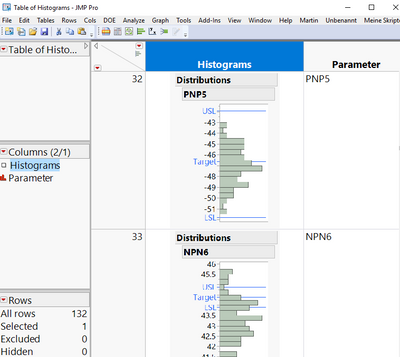
Can you show your results?, e.g. providing the resulting data table?
/****NeverStopLearning****/
Staff
- Mark as New
- Bookmark
- Subscribe
- Mute
- Subscribe to RSS Feed
- Get Direct Link
- Report Inappropriate Content
Re: [JSL] Local Data Filter Selection Not Being Applied When Generating Table of Graphs
I checked in 14.3 and I see what you mean. There might be a bug which has been fixed. Best to ask Tech Support for clarification.
([email protected]). My results shown above were done with JMP 15.1
([email protected]). My results shown above were done with JMP 15.1
/****NeverStopLearning****/
Level II
Solution
- Mark as New
- Bookmark
- Subscribe
- Mute
- Subscribe to RSS Feed
- Get Direct Link
- Report Inappropriate Content
Re: [JSL] Local Data Filter Selection Not Being Applied When Generating Table of Graphs
@martindemel Thank you for helping to dig into this issue. I ended up submitting a tech support ticket and, through a bit of experimentation, we figured out that if a wait(0) statement is inserted between the creation of the Distribution report and the GetPicture statement in my original code, the issue goes away (although there is a considerable slow down). The << Update Window command also corrects the issue, but does not cause the code execution slowdown the wait () statement. Thanks, AW
Recommended Articles
- © 2026 JMP Statistical Discovery LLC. All Rights Reserved.
- Terms of Use
- Privacy Statement
- Contact Us