- New to JMP? Join us Sept. 23-24 for the Early User Edition of Discovery Summit, tailor-made for new users. Register now for free!
- Your voice matters! Tell us how you prefer to receive JMP updates, so we can tailor our communication to your needs. Take short survey.
- See how to access JMP Marketplace - and - find, create & share add-ins to extend your JMP. Watch video.
- Subscribe to RSS Feed
- Mark Topic as New
- Mark Topic as Read
- Float this Topic for Current User
- Bookmark
- Subscribe
- Mute
- Printer Friendly Page
Discussions
Solve problems, and share tips and tricks with other JMP users.- JMP User Community
- :
- Discussions
- :
- Re: Is it possible to use a custom equation to fit the data in graph builder?

- Mark as New
- Bookmark
- Subscribe
- Mute
- Subscribe to RSS Feed
- Get Direct Link
- Report Inappropriate Content
Is it possible to use a custom equation to fit the data in graph builder?
Hi!
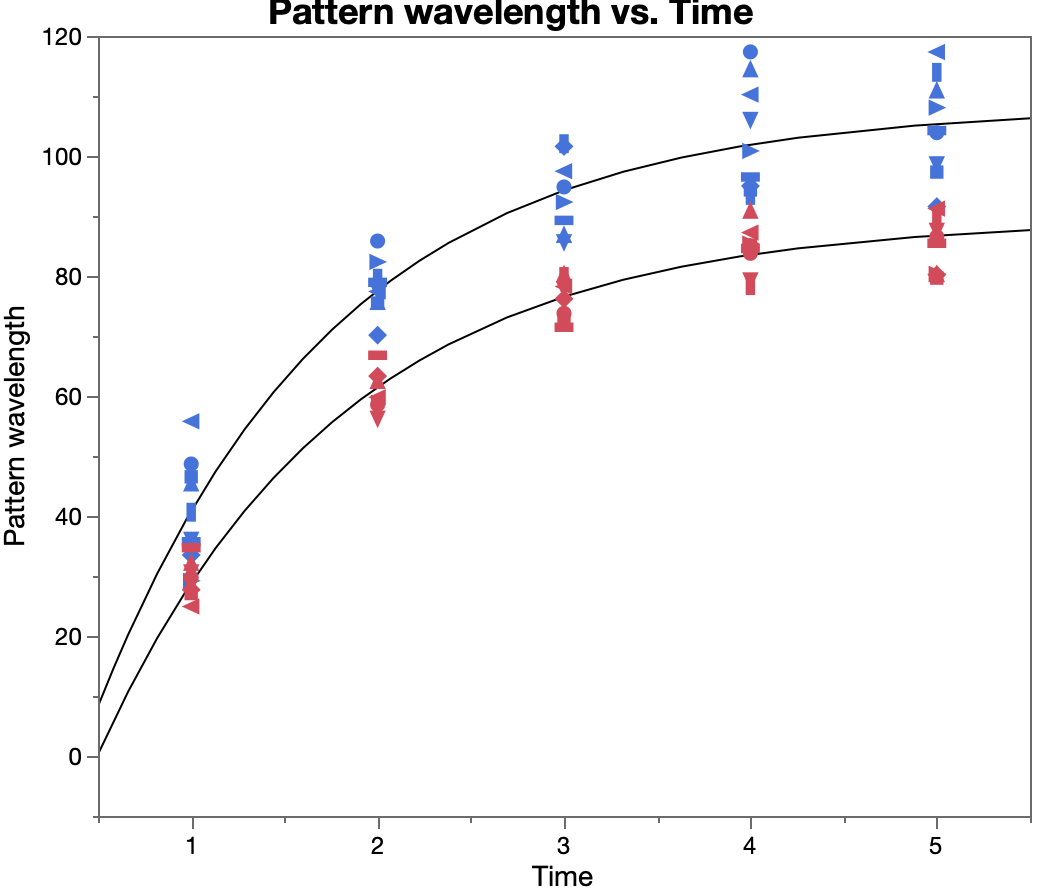
I've used graph builder to plot the data with grouped X (as shown in the attached image). I wanted to fit all three curves using an exponential growth function. I only found Line of Fit and Smoother functions, but these are not what I would like to do. I was wondering if it is possible to customize the fitting equation and also display the confidence interval of the fit as well as the statistics of the fit (e.g. R^2, F-test, equation) in the graph?
Thanks!
Accepted Solutions

- Mark as New
- Bookmark
- Subscribe
- Mute
- Subscribe to RSS Feed
- Get Direct Link
- Report Inappropriate Content
Re: Is it possible to use a custom equation to fit the data in graph builder?
I think your latest graph has taken Graph Builder built in functionality to it's max. To go where you seem to want to take it, I think you need to study up on the ability to add any graphical items to Graph Builder or any other of the graphical outputs, using the adding of graphics scripts to the outputs frame boxes. The interactive form of this, is surfaced by right clicking on a graph and selecting "Customize". This entrance to the graphical scripting world in JMP, provides one with some sample templates and scripts. However, this simple introduction, can be expanded within the JSL environment, to do just about anything you want in your graph.
I suggest you read the Scripting Guide, but that is a pretty big bite. So at a minimum, you need to read the section on Scripting Graphs in the Scripting Guide.
- Mark as New
- Bookmark
- Subscribe
- Mute
- Subscribe to RSS Feed
- Get Direct Link
- Report Inappropriate Content
Re: Is it possible to use a custom equation to fit the data in graph builder?
By using the two axis option you can separate 2 Y columns into independent items. Y column 1 is your actual values, and Y column 2 is the resulting value for the exponential growth function. Here is an example using the attached data table with the embedded script. You can also use the <<add graphic script to add to any graph and function, etc. That is another option for doing what you want

- Mark as New
- Bookmark
- Subscribe
- Mute
- Subscribe to RSS Feed
- Get Direct Link
- Report Inappropriate Content
Re: Is it possible to use a custom equation to fit the data in graph builder?
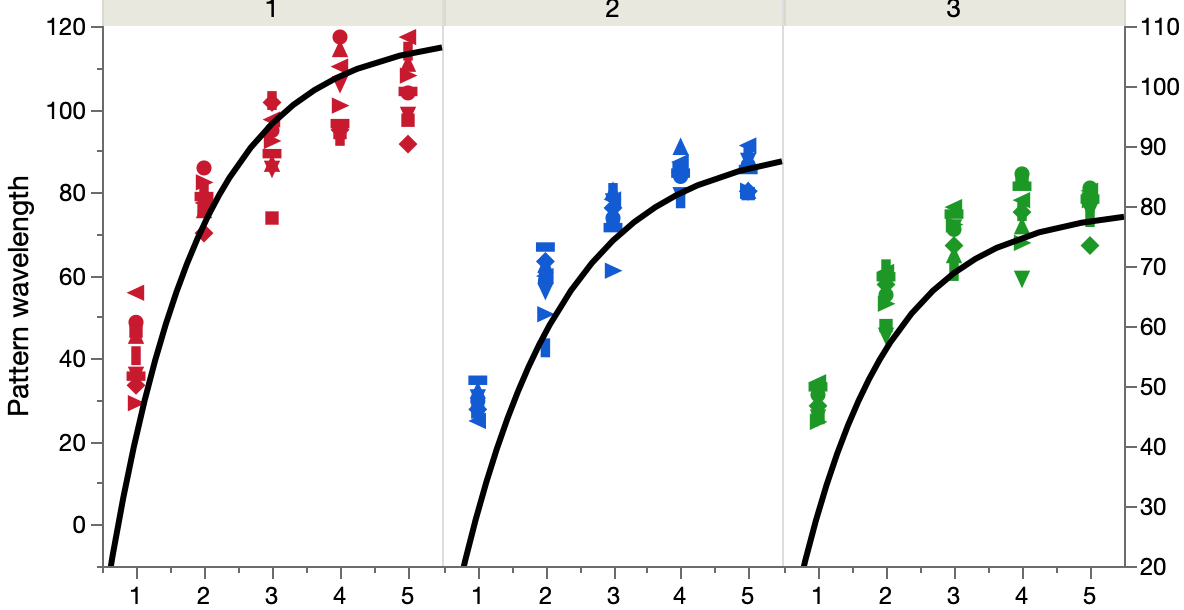
@txnelson Thanks for your reply. I tried to use your method to do the fitting, however, I don't know how to set up the if statement when there are three conditions (I have three concentrations, please see the attached data table). Can you please show me how to set up the if statement for my case? I also found another method that Julian suggested Adding a regression line with known slope in Graph Builder. It worked for my plot (attached image). However, I still don't know how to add a confidence interval band to each fit. Is that something possible to do? Thanks

- Mark as New
- Bookmark
- Subscribe
- Mute
- Subscribe to RSS Feed
- Get Direct Link
- Report Inappropriate Content
Re: Is it possible to use a custom equation to fit the data in graph builder?
You can using any fitting platform in JMP and save the selected model as a column formula. Graph Builder has a graphics element called formula that uses the custom model. Drag the saved model to the Y drop zone, then change the plotting element to Formula.
- Mark as New
- Bookmark
- Subscribe
- Mute
- Subscribe to RSS Feed
- Get Direct Link
- Report Inappropriate Content
Re: Is it possible to use a custom equation to fit the data in graph builder?
Hi @Mark_Bailey,
I tried the method you suggested. I created a separate column for the fitted formula. I then dragged the column to the Y drop and changed the plotting element to Formula (the third icon from the top right). However, I can only see the fitting curve without the raw data points. I tried to drag the raw data point column to Overlay, but it still didn't show the data points. Also, is it possible to draw the confidence interval around the fitted curve?
Thank you!
- Mark as New
- Bookmark
- Subscribe
- Mute
- Subscribe to RSS Feed
- Get Direct Link
- Report Inappropriate Content
Re: Is it possible to use a custom equation to fit the data in graph builder?
@CYLiaw If you take a look at the method that I suggested, you will see that what you need to do to get the points and the line displayed is to drag both the actual and the predicted values to the Y axis, and the right click on the axis settings and move one of the 2 columns to the right axis.
- Mark as New
- Bookmark
- Subscribe
- Mute
- Subscribe to RSS Feed
- Get Direct Link
- Report Inappropriate Content
Re: Is it possible to use a custom equation to fit the data in graph builder?
Hi @txnelson thanks for the tip. The plot looks much better now (please see the attached image). However, I still don't know how to add the confidence interval of the fit. I also tried to use the nonlinear fitting (analyze-->specialized modeling -->nonlinear), but it didn't output any confidence interval information. I was just wondering if it is possible to add the confidence interval manually in JMP?
I really appreciate your help.
- Mark as New
- Bookmark
- Subscribe
- Mute
- Subscribe to RSS Feed
- Get Direct Link
- Report Inappropriate Content
Re: Is it possible to use a custom equation to fit the data in graph builder?
I think your latest graph has taken Graph Builder built in functionality to it's max. To go where you seem to want to take it, I think you need to study up on the ability to add any graphical items to Graph Builder or any other of the graphical outputs, using the adding of graphics scripts to the outputs frame boxes. The interactive form of this, is surfaced by right clicking on a graph and selecting "Customize". This entrance to the graphical scripting world in JMP, provides one with some sample templates and scripts. However, this simple introduction, can be expanded within the JSL environment, to do just about anything you want in your graph.
I suggest you read the Scripting Guide, but that is a pretty big bite. So at a minimum, you need to read the section on Scripting Graphs in the Scripting Guide.
- Mark as New
- Bookmark
- Subscribe
- Mute
- Subscribe to RSS Feed
- Get Direct Link
- Report Inappropriate Content
Re: Is it possible to use a custom equation to fit the data in graph builder?
Do not put the data column in the overlay role. Drag the data column to the Y role, just inside the plotting frame. You should see a blue shape appear and the plot should update to show you what will happen. Do not let up on the mouse button until you see the markers added to the plot of the graph of the function.
This process is described in Help > JMP Documentation > Essential Graphing. See the Graph Builder chapters.

- Mark as New
- Bookmark
- Subscribe
- Mute
- Subscribe to RSS Feed
- Get Direct Link
- Report Inappropriate Content
Re: Is it possible to use a custom equation to fit the data in graph builder?
I've been following this example and it does exactly what I need with one exception. Once the graph is created, is it possible to hide the axis on the right side of the graph? I can get rid of the tick marks, delete label and set a really large increment, but I still have values as the start and end of the axis.
Recommended Articles
- © 2026 JMP Statistical Discovery LLC. All Rights Reserved.
- Terms of Use
- Privacy Statement
- Contact Us