- Subscribe to RSS Feed
- Mark Topic as New
- Mark Topic as Read
- Float this Topic for Current User
- Bookmark
- Subscribe
- Mute
- Printer Friendly Page
Discussions
Solve problems, and share tips and tricks with other JMP users.- JMP User Community
- :
- Discussions
- :
- Re: Is it possible to have two different Reference Ranges?
- Mark as New
- Bookmark
- Subscribe
- Mute
- Subscribe to RSS Feed
- Get Direct Link
- Report Inappropriate Content
Is it possible to have two different Reference Ranges?
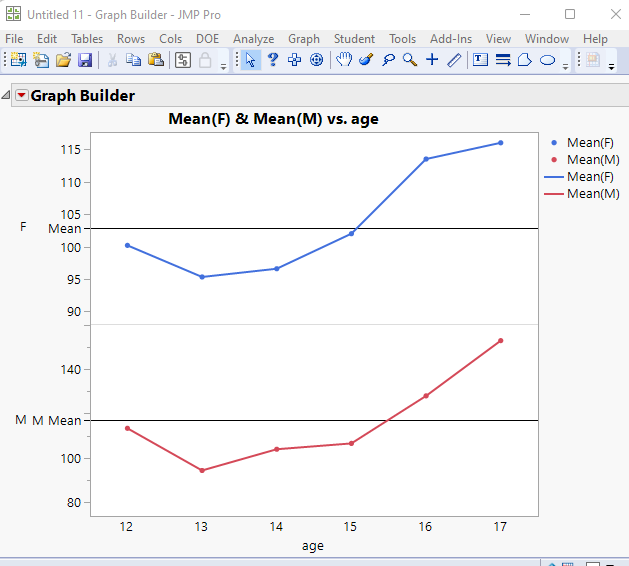
I need to add two different references ranges to my graphic. Is that possible? In the sample graphic below, I want the range to be different for males as it is for females. I have learned how to add a reference range, but I dont want it repeated in each group.
- Mark as New
- Bookmark
- Subscribe
- Mute
- Subscribe to RSS Feed
- Get Direct Link
- Report Inappropriate Content
Re: Is it possible to have two different Reference Ranges?
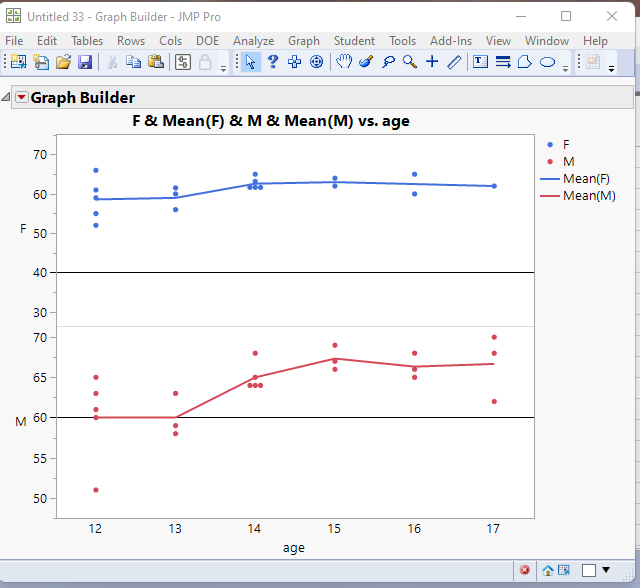
The solution involves the splitting of the data table by sex, so you have a Male column and a Female column. Then you drag the Female column to the Y axis, and then drag the Male column to the Y axis, but adding it lower on the axis. It will create a second graph, which you can then add different reference lines
- Mark as New
- Bookmark
- Subscribe
- Mute
- Subscribe to RSS Feed
- Get Direct Link
- Report Inappropriate Content
Re: Is it possible to have two different Reference Ranges?
Hi Jim, I am not sure how that is different than the graphic I sent originally. It is two different graphs, split by sex.
- Mark as New
- Bookmark
- Subscribe
- Mute
- Subscribe to RSS Feed
- Get Direct Link
- Report Inappropriate Content
Re: Is it possible to have two different Reference Ranges?
The reference lines are different for the males and females. When the males and females are entered as 2 different columns, on the same y axis, the 2 graphs they produce have the ability to changes the axes, and set reference lines independently.
- Mark as New
- Bookmark
- Subscribe
- Mute
- Subscribe to RSS Feed
- Get Direct Link
- Report Inappropriate Content
Re: Is it possible to have two different Reference Ranges?
It's possible to do this with a little JSL. Once you have the graph made but without any references ranges, right click inside either the Male or Female section of the graph and select Customize. From there, click the plus sign on the top left to add a new JSL element. Use JSL's Polygon function to draw a rectangle spanning the part of the graph corresponding to your range for that group. This will be drawn only in the section of the graph you right clicked in.
Here's example JSL for your Female group (with a black fill at 25% transparency). The arguments in the Polygon function are X,Y coordinates drawn in order.
Transparency( 0.25 );
Fill Color( "black" );
Polygon( {0, 40 }, {0, 30}, {400, 30}, {400, 40} );
You can then repeat for the Male group's section of the graph, swapping in the proper X,Y coordinates for that group.
JMP Academic Ambassador
Recommended Articles
- © 2026 JMP Statistical Discovery LLC. All Rights Reserved.
- Terms of Use
- Privacy Statement
- Contact Us


