- Subscribe to RSS Feed
- Mark Topic as New
- Mark Topic as Read
- Float this Topic for Current User
- Bookmark
- Subscribe
- Mute
- Printer Friendly Page
Discussions
Solve problems, and share tips and tricks with other JMP users.- JMP User Community
- :
- Discussions
- :
- Add reference line to distribution plot
- Mark as New
- Bookmark
- Subscribe
- Mute
- Subscribe to RSS Feed
- Get Direct Link
- Report Inappropriate Content
Add reference line to distribution plot
Hi,
I want to add a reference line in the distribution plots.
The reference values are stored in the second file "Reference data table"
Here's my code: It doesn't works on histogram plots but works on Var charts. Any advice would be appreciated
Names Default To Here( 1 );


dt1 = Data table( "Reference data table.jmp");
dt2 = Current Data Table();
Col_List = dt2 << Get Column Group( "Tests" );


vc2 = Eval(
	Eval Expr(
		dt2 << distribution(
			Stack( 1 ),

			Column( Expr( Col_List ) ),
			Horizontal Layout( 1 ),
			Normal Quantile Plot( 1 ),
			Vertical( 1 ),
			Process Capability( 0 )

		)
	)
);

aa_refs = Associative Array( dt1:Tests << get values, dt1:Mean << get values );

For( i = 1, i <= N Items( Col_List ), i++,
	If( Contains( aa_refs, Col_List[i] ),
		Report( vc2[i] )[Framebox( 1 )] << DispatchSeg( CustomStreamSeg( 3 ), {Line Width( 2 )} );
		Report( vc2[i] )[AxisBox( 1 )] << {Add Ref Line( aa_refs[Col_List[i]], "Solid", "Green", "RTS", 2 )};
	)
);
Accepted Solutions
- Mark as New
- Bookmark
- Subscribe
- Mute
- Subscribe to RSS Feed
- Get Direct Link
- Report Inappropriate Content
Re: Add reference line to distribution plot
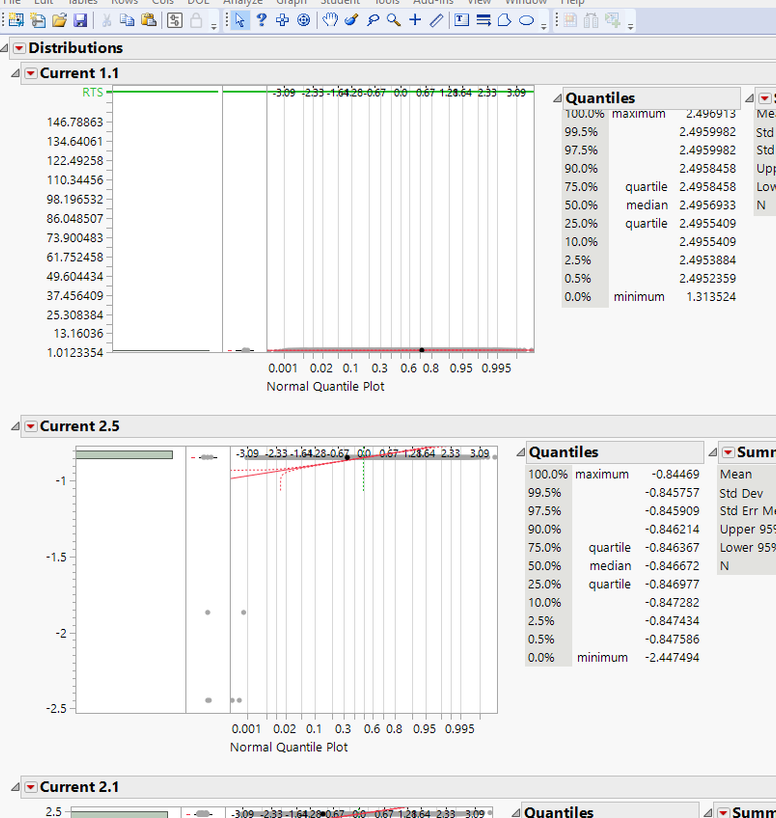
Here is a rework of your script. The issue you are having is that the Display Tree for Bivariate is different than the Display Tree output from the Variance charts. You need to read the section in the Scripting Guide on Display Trees so you can work with the various forms of the output. Also, the Means from your reference table seem to be wrong. See the output below. The mean for Current 1.1 is listed as 166, and the listed maximum is only 2.49.
Names Default To Here( 1 );

dt1 = Data table( "Reference data table.jmp");
dt2 = Data table("Data table upd");//("Current Data Table();
Col_List = dt2 << Get Column Group( "Tests");


vc2 = Eval(
	Eval Expr(
		dt2 << distribution(
			Stack( 1 ),

			Column( Expr( Col_List ) ),
			Horizontal Layout( 1 ),
			Normal Quantile Plot( 1 ),
			Vertical( 1 ),
			Process Capability( 0 )

		)
	)
);

aa_refs = Associative Array( dt1:Tests << get values, dt1:Mean << get values );

/*For( i = 1, i <= N Items( Col_List ), i++,
	If( Contains( aa_refs, Col_List[i] ),
		Report( vc2[i] )[Framebox( 1 )] << DispatchSeg( CustomStreamSeg( 3 ), {Line Width( 2 )} );
		Report( vc2[i] )[AxisBox( 1 )] << {Add Ref Line( aa_refs[Col_List[i]], "Solid", "Green", "RTS", 2 )};
	)
);*/


For( i = 1, i <= N Items( Col_List ), i++,
	If( Contains( aa_refs, char(Col_List[i]) ),
		Report( vc2 )[char(Col_List[i])][Axisbox( 1 )] << Add Ref Line( aa_refs[char(Col_List[i])], "Solid", "Green", "RTS", 2 );
	)
);
- Mark as New
- Bookmark
- Subscribe
- Mute
- Subscribe to RSS Feed
- Get Direct Link
- Report Inappropriate Content
Re: Add reference line to distribution plot
@txnelson any suggestions?
- Mark as New
- Bookmark
- Subscribe
- Mute
- Subscribe to RSS Feed
- Get Direct Link
- Report Inappropriate Content
Re: Add reference line to distribution plot
Here is a rework of your script. The issue you are having is that the Display Tree for Bivariate is different than the Display Tree output from the Variance charts. You need to read the section in the Scripting Guide on Display Trees so you can work with the various forms of the output. Also, the Means from your reference table seem to be wrong. See the output below. The mean for Current 1.1 is listed as 166, and the listed maximum is only 2.49.
Names Default To Here( 1 );

dt1 = Data table( "Reference data table.jmp");
dt2 = Data table("Data table upd");//("Current Data Table();
Col_List = dt2 << Get Column Group( "Tests");


vc2 = Eval(
	Eval Expr(
		dt2 << distribution(
			Stack( 1 ),

			Column( Expr( Col_List ) ),
			Horizontal Layout( 1 ),
			Normal Quantile Plot( 1 ),
			Vertical( 1 ),
			Process Capability( 0 )

		)
	)
);

aa_refs = Associative Array( dt1:Tests << get values, dt1:Mean << get values );

/*For( i = 1, i <= N Items( Col_List ), i++,
	If( Contains( aa_refs, Col_List[i] ),
		Report( vc2[i] )[Framebox( 1 )] << DispatchSeg( CustomStreamSeg( 3 ), {Line Width( 2 )} );
		Report( vc2[i] )[AxisBox( 1 )] << {Add Ref Line( aa_refs[Col_List[i]], "Solid", "Green", "RTS", 2 )};
	)
);*/


For( i = 1, i <= N Items( Col_List ), i++,
	If( Contains( aa_refs, char(Col_List[i]) ),
		Report( vc2 )[char(Col_List[i])][Axisbox( 1 )] << Add Ref Line( aa_refs[char(Col_List[i])], "Solid", "Green", "RTS", 2 );
	)
);
Recommended Articles
- © 2026 JMP Statistical Discovery LLC. All Rights Reserved.
- Terms of Use
- Privacy Statement
- Contact Us


