- Sign-in to the JMP Community will be unavailable intermittently Dec. 6-7 due to a system update. Thank you for your understanding!
- We’re retiring the File Exchange at the end of this year. The JMP Marketplace is now your destination for add-ins and extensions.
- JMP 19 is here! Learn more about the new features.
- Subscribe to RSS Feed
- Mark Topic as New
- Mark Topic as Read
- Float this Topic for Current User
- Bookmark
- Subscribe
- Mute
- Printer Friendly Page
Discussions
Solve problems, and share tips and tricks with other JMP users.- JMP User Community
- :
- Discussions
- :
- How to work with datasets that are structured by rows and columns
- Mark as New
- Bookmark
- Subscribe
- Mute
- Subscribe to RSS Feed
- Get Direct Link
- Report Inappropriate Content
How to work with datasets that are structured by rows and columns
Hello jmp community,
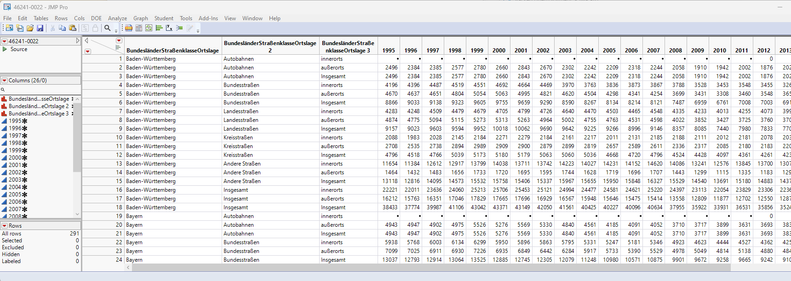
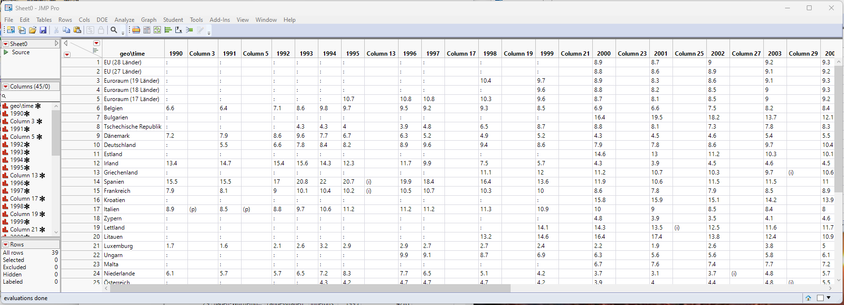
i am a relative beginner in JMP and analytics in general and am getting to my limits in working with datasets that don't have a common structure. I am not sure how data like that is actually called, which makes it hard for me to describe it in words. Basically, there is e.g. a column for every year and rows are not just single observations of a person or similar, but a more complex, hierarchical structure for the rows. (Example files are in the attachment, so you know what i mean) In any case, this structure makes it near impossible for me to make meaningfol reports. Is there a general way to approach working with such data?
Thanks so much for your help!
Accepted Solutions
- Mark as New
- Bookmark
- Subscribe
- Mute
- Subscribe to RSS Feed
- Get Direct Link
- Report Inappropriate Content
Re: How to work with datasets that are structured by rows and columns
Welcome to the community.
Your data is easily entered into JMP, with the Excel Wizard, to guide you through.
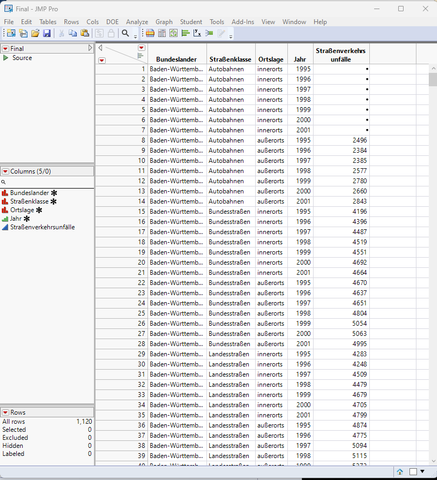
Typically the analytical format of the data is laid out vertically, not horizontally. Therefore stacking all of your year data is how I would typically start.
I have provided a couple of scripts that I put together that read in the 2 spreadsheets you provided. In both cases, I input and transformed the data using interactive JMP, and then took from JMP, the scripts it produced to do the actual work, and saved them into the scripts below.
For the Verkehrsunfalle data
Names Default To Here( 1 );
dt = Open(
	"path to your data",
	Worksheets( "46241-0022" ),
	Use for all sheets( 1 ),
	Concatenate Worksheets( 0 ),
	Create Concatenation Column( 0 ),
	Worksheet Settings(
		1,
		Has Column Headers( 1 ),
		Number of Rows in Headers( 1 ),
		Headers Start on Row( 4 ),
		Data Starts on Row( 5 ),
		Data Starts on Column( 1 ),
		Data Ends on Row( 0 ),
		Data Ends on Column( 0 ),
		Replicated Spanned Rows( 1 ),
		Replicated Spanned Headers( 0 ),
		Suppress Hidden Rows( 1 ),
		Suppress Hidden Columns( 1 ),
		Suppress Empty Columns( 1 ),
		Treat as Hierarchy( 0 ),
		Multiple Series Stack( 0 ),
		Import Cell Colors( 0 ),
		Limit Column Detect( 0 ),
		Column Separator String( "-" )
	)
);

// Fill in rows where repeating values have been deleted
For( i = 1, i <= 2, i++,
	For( k = 1, k <= N Rows( dt ), k++,
		If( Column( i )[k] != "",
			hold = Column( i )[k]
		);

		Column( i )[k] = hold;

	)
);

// Get rid of dashes being used as an indicator of blank data
// Also, change columns to numeric after the dashes are changed
for(i=4,i<=ncols(dt),i++,
	try(as column(i)[dt<<get rows where(as column(i)=="-")] = "");
	column(i)<<data type(numeric)<<modeling type(continuous);
);

// Stack all of the Years data
dtStack = dt << Stack(
	columns( :"1995"n, :"1996"n, :"1997"n, :"1998"n, :"1999"n, :"2000"n, :"2001"n ),
	Source Label Column( "Jahr" ),
	Stacked Data Column( "Straßenverkehrsunfälle" ),
	"Non-stacked columns"n(
		Keep(
			:BundesländerStraßenklasseOrtslage, :BundesländerStraßenklasseOrtslage 2,
			:BundesländerStraßenklasseOrtslage 3
		)
	),
	Output Table( "Final" )
);

// Change the Jahr column to numeric, ordinal
dtStack:Jahr << data type(numeric)<<modeling type(ordinal);

// Change column names to meaningful names
column(dtStack, 1) << set name("Bundeslander");
column(dtStack, 2) << set name("Straßenklasse");
column(dtStack, 3) << set name("Ortslage");

// Entfernen Sie die Kategorie "Insgesamt"
dtStack << select where( :Ortslage == "Insgesamt" );
dtStack << delete rows;
dtStack << select where( :Straßenklasse == "Insgesamt" );
dtStack << delete rows;
For the Eurostat data
Again entered into JMP using the Excel Wizard, and then stacking the data
names default to here(1);
dt = // Import Excel file: lebTHI_EurostatTable.xls
// → Data Table( "Sheet0" )
Open(
	"path to your data",
	Worksheets( "Sheet0" ),
	Use for all sheets( 1 ),
	Concatenate Worksheets( 0 ),
	Create Concatenation Column( 0 ),
	Worksheet Settings(
		1,
		Has Column Headers( 1 ),
		Number of Rows in Headers( 1 ),
		Headers Start on Row( 3 ),
		Data Starts on Row( 4 ),
		Data Starts on Column( 1 ),
		Data Ends on Row( 0 ),
		Data Ends on Column( 0 ),
		Replicated Spanned Rows( 1 ),
		Replicated Spanned Headers( 0 ),
		Suppress Hidden Rows( 1 ),
		Suppress Hidden Columns( 1 ),
		Suppress Empty Columns( 1 ),
		Treat as Hierarchy( 0 ),
		Multiple Series Stack( 0 ),
		Import Cell Colors( 0 ),
		Limit Column Detect( 0 ),
		Column Separator String( "-" )
	)
);

// delete rows where footnotes were input
dt << select where(:"1997"n =="");
dt << delete rows;

// Stack all of the year data
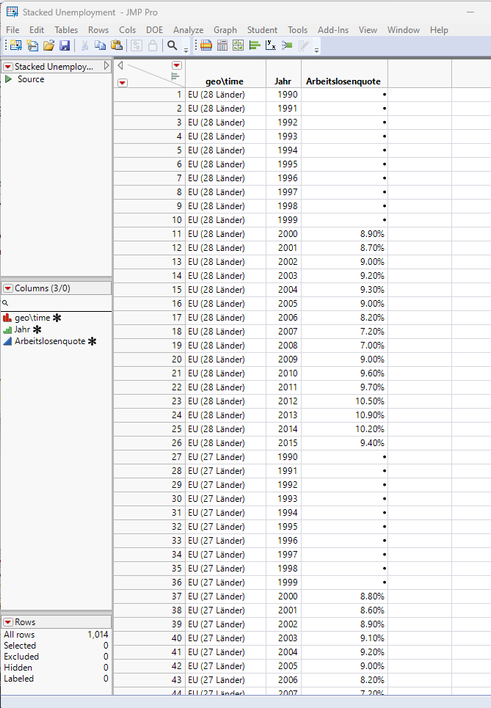
dtStack = dt << Stack(
	columns(
		:"1990"n, :"1991"n, :"1992"n, :"1993"n, :"1994"n, :"1995"n, :"1996"n,
		:"1997"n, :"1998"n, :"1999"n, :"2000"n, :"2001"n, :"2002"n, :"2003"n,
		:"2004"n, :"2005"n, :"2006"n, :"2007"n, :"2008"n, :"2009"n, :"2010"n,
		:"2011"n, :"2012"n, :"2013"n, :"2014"n, :"2015"n
	),
	Source Label Column( "Jahr" ),
	Stacked Data Column( "Arbeitslosenquote" ),
	"Non-stacked columns"n( Keep( :geo\time ) ),
	Output Table( "Stacked Unemployment " )
);

// Change : to blanks
dtStack:Arbeitslosenquote[dtStack << get rows where(:Arbeitslosenquote == ":")] = "";

// Change Arbeitslosenquote to numeric, continuous
dtStack:Arbeitslosenquote << datatype(numeric)<<modelingtype(continuous);

// Convert to JMP percent value and change display format
for each row( :Arbeitslosenquote = :Arbeitslosenquote/100);
dtStack:Arbeitslosenquote<<format("Percent", 7,2);

// Change Jahr to numeric, ordinal
dtStack:Jahr << datatype(numeric)<<modelingtype(ordinal);
- Mark as New
- Bookmark
- Subscribe
- Mute
- Subscribe to RSS Feed
- Get Direct Link
- Report Inappropriate Content
Re: How to work with datasets that are structured by rows and columns
Nice! Thanks for showing a general approach for converting the human-friendly representation into a computer-friendly format. I particularly liked
Entfernen Sie die Kategorie "Insgesamt"at the end of the first one. Maybe there was a formula to calculate those totals at some point.
- Mark as New
- Bookmark
- Subscribe
- Mute
- Subscribe to RSS Feed
- Get Direct Link
- Report Inappropriate Content
Re: How to work with datasets that are structured by rows and columns
Hello, thanks a lot for taking the time for such a good answer! I will try it myself soon when I get around to it, following to your guide, and let you know how it went. :)
Recommended Articles
- © 2025 JMP Statistical Discovery LLC. All Rights Reserved.
- Terms of Use
- Privacy Statement
- Contact Us


