- Subscribe to RSS Feed
- Mark Topic as New
- Mark Topic as Read
- Float this Topic for Current User
- Bookmark
- Subscribe
- Mute
- Printer Friendly Page
Discussions
Solve problems, and share tips and tricks with other JMP users.- JMP User Community
- :
- Discussions
- :
- Re: How to show the actual range in the level values in Graph Builder?
- Mark as New
- Bookmark
- Subscribe
- Mute
- Subscribe to RSS Feed
- Get Direct Link
- Report Inappropriate Content
How to show the actual range in the level values in Graph Builder?

In the attached plot, the property of column "ChannelNumber" is Numeric/Continuous. I found it confusing in the grouped values at the top. "0-4" actually includes 0-3, as shown at the bottom; "4-8" actualy includes 4-7. It seems the range at the top always has overlapping values between adjacent levels. What can I do to make this overlap go away (i.e. I want it to show "0-3", "4-7","8-11" at the top)? Thank you very much...
- Mark as New
- Bookmark
- Subscribe
- Mute
- Subscribe to RSS Feed
- Get Direct Link
- Report Inappropriate Content
Re: How to show the actual range in the level values in Graph Builder?
Hi Jane
增加一个新的列,将你原先的信道归纳到这3个分类里。(0~3,4~7,8~11)
用新增的列作为X group即可实现你的需求。
- Mark as New
- Bookmark
- Subscribe
- Mute
- Subscribe to RSS Feed
- Get Direct Link
- Report Inappropriate Content
Re: How to show the actual range in the level values in Graph Builder?
Thank you Frank. I wonder if there is a way other than adding a new column...
- Mark as New
- Bookmark
- Subscribe
- Mute
- Subscribe to RSS Feed
- Get Direct Link
- Report Inappropriate Content
Re: How to show the actual range in the level values in Graph Builder?
If you have JMP16, you could create Custom Range:
Or in this case it might be enough if you just change the Bin Label Style from Cutpoints red triangle in same Custom Levels menu.
Default:
Using Low to high - 1
- Mark as New
- Bookmark
- Subscribe
- Mute
- Subscribe to RSS Feed
- Get Direct Link
- Report Inappropriate Content
Re: How to show the actual range in the level values in Graph Builder?
Thanks, but I am using JMP14. There is no "Custom Levels" option. The closest I can get it to add a Binning column:
Any other ideas please?
- Mark as New
- Bookmark
- Subscribe
- Mute
- Subscribe to RSS Feed
- Get Direct Link
- Report Inappropriate Content
Re: How to show the actual range in the level values in Graph Builder?
Just wanted to point out that if the value is continuous, then what happens if you have a value of 3.9? What about 3.999999? The default is that the intervals are left inclusive. Mathematically it would be written as [0,4), [4,8), etc..
It sounds like you might want to consider the data as ordinal if the fractions are not possible.
- Mark as New
- Bookmark
- Subscribe
- Mute
- Subscribe to RSS Feed
- Get Direct Link
- Report Inappropriate Content
Re: How to show the actual range in the level values in Graph Builder?
Thanks, Dan. I tried that too. This is what I got after setting it to ordinal:
- Mark as New
- Bookmark
- Subscribe
- Mute
- Subscribe to RSS Feed
- Get Direct Link
- Report Inappropriate Content
Re: How to show the actual range in the level values in Graph Builder?
Unfortunately, I don't have JMP 14 to hand to check - But if you right click on 'ChannelNumber' in the Graph Builder display immediately above, do you see some options that allow you to control the number of levels displayed?
- Mark as New
- Bookmark
- Subscribe
- Mute
- Subscribe to RSS Feed
- Get Direct Link
- Report Inappropriate Content
Re: How to show the actual range in the level values in Graph Builder?
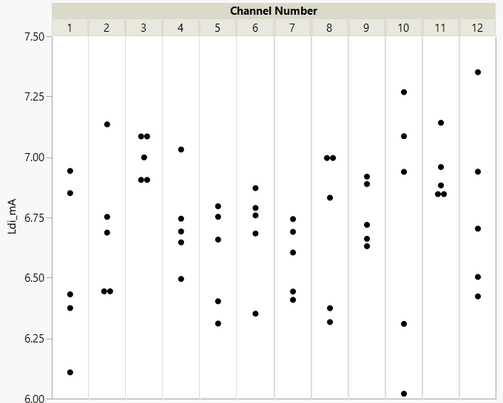
I do have version 14. If you right-click on the channel number, select Number of Levels. From your first example, that would be 12 levels. Not sure why yours defaulted to 3 levels as mine defaulted to all levels.
I made a simple example, and it looks like this (as a scatterplot rather than boxplot).
- Mark as New
- Bookmark
- Subscribe
- Mute
- Subscribe to RSS Feed
- Get Direct Link
- Report Inappropriate Content
Re: How to show the actual range in the level values in Graph Builder?
Thanks Dan. I was trying to make the ChannelNumber into 3 equal groups, as in 0-3, 4-7, 8-11. Number of Levels to display was set to 3. My original question was how to make it show "0-3","4-7","8-11" at the top, instead of "0-4","4-8","8-11", without adding another column.
Recommended Articles
- © 2026 JMP Statistical Discovery LLC. All Rights Reserved.
- Terms of Use
- Privacy Statement
- Contact Us


