- Don’t miss your chance to experience Discovery Summit Europe at our best available rate! Early bird registration through 31 Oct.
- Graph Builder Toolbar streamlines interactive graphing. Creates shortcuts on Report and GraphBuilder Helpers toolbars. Download and install the extension.
- Subscribe to RSS Feed
- Mark Topic as New
- Mark Topic as Read
- Float this Topic for Current User
- Bookmark
- Subscribe
- Mute
- Printer Friendly Page
Discussions
Solve problems, and share tips and tricks with other JMP users.- User Community
- :
- Discussions
- :
- Re: How to set different Spec lines for different projects in the graph builder

- Mark as New
- Bookmark
- Subscribe
- Mute
- Subscribe to RSS Feed
- Get Direct Link
- Report Inappropriate Content
How to set different Spec lines for different projects in the graph builder
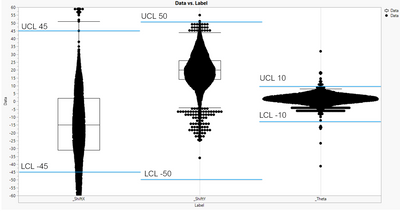
How to set different Spec lines for different projects in the graph builder, like this.
Accepted Solutions


- Mark as New
- Bookmark
- Subscribe
- Mute
- Subscribe to RSS Feed
- Get Direct Link
- Report Inappropriate Content
Re: How to set different Spec lines for different projects in the graph builder
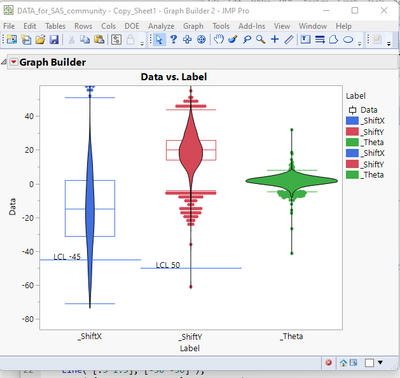
Here is a partial script to solve what you want. I have only displayed 2 of the Spec limits lines, but the addition of the other lines is just a repeat of the JSL, just changing the coordinates and text.
Names Default To Here( 1 );
dt = Current Data Table();
gb = Graph Builder(
	Size( 528, 448 ),
	Show Control Panel( 0 ),
	Variables( X( :Label ), Y( :Data ), Color( :Label ) ),
	Elements( Box Plot( X, Y, Legend( 11 ) ), Contour( X, Y, Legend( 12 ) ) ),
	SendToReport(
		Dispatch(
			{},
			"Data",
			ScaleBox,
			{Format( "Best", 12 ), Min( -86.4411315121441 ), Max( 58.2086540147458 ), Inc( 20 ),
			Minor Ticks( 1 )}
		)
	)
);
Report( gb )[framebox( 1 )] << add graphics script(
	Pen Color( "blue" );
	Line( [-.5 .5], [-45 -45] );
	Text( {-.45, -40, 0, -42}, "LCL -45" );
	Line( [.5 1.5], [-50 -50] );
	Text( {.55, -45, 1, -47}, "LCL 50" );
);- Mark as New
- Bookmark
- Subscribe
- Mute
- Subscribe to RSS Feed
- Get Direct Link
- Report Inappropriate Content
Re: How to set different Spec lines for different projects in the graph builder
Here is a partial script to solve what you want. I have only displayed 2 of the Spec limits lines, but the addition of the other lines is just a repeat of the JSL, just changing the coordinates and text.
Names Default To Here( 1 );
dt = Current Data Table();
gb = Graph Builder(
	Size( 528, 448 ),
	Show Control Panel( 0 ),
	Variables( X( :Label ), Y( :Data ), Color( :Label ) ),
	Elements( Box Plot( X, Y, Legend( 11 ) ), Contour( X, Y, Legend( 12 ) ) ),
	SendToReport(
		Dispatch(
			{},
			"Data",
			ScaleBox,
			{Format( "Best", 12 ), Min( -86.4411315121441 ), Max( 58.2086540147458 ), Inc( 20 ),
			Minor Ticks( 1 )}
		)
	)
);
Report( gb )[framebox( 1 )] << add graphics script(
	Pen Color( "blue" );
	Line( [-.5 .5], [-45 -45] );
	Text( {-.45, -40, 0, -42}, "LCL -45" );
	Line( [.5 1.5], [-50 -50] );
	Text( {.55, -45, 1, -47}, "LCL 50" );
);
- Mark as New
- Bookmark
- Subscribe
- Mute
- Subscribe to RSS Feed
- Get Direct Link
- Report Inappropriate Content
Re: How to set different Spec lines for different projects in the graph builder
How to change the line width?
Line( [-.5 .5], [-45 -45] );

- Mark as New
- Bookmark
- Subscribe
- Mute
- Subscribe to RSS Feed
- Get Direct Link
- Report Inappropriate Content
Re: How to set different Spec lines for different projects in the graph builder
If you can add limits to your data this way:
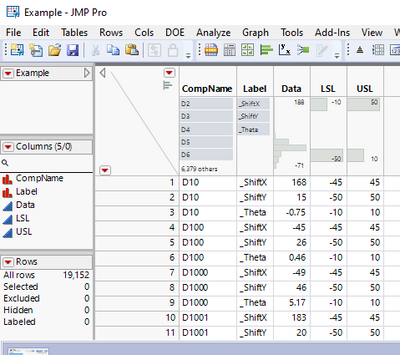
you can add second graph to graph builder. If you want labels I think float bar chart is easiest (but try other visualizations also!). Building these can be sometimes a bit annoying, but the important parts are highlighted here:
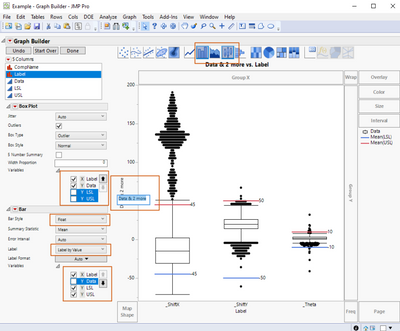
Building the graph this way does have its benefits especially if you have local data filters
Recommended Articles
- © 2026 JMP Statistical Discovery LLC. All Rights Reserved.
- Terms of Use
- Privacy Statement
- Contact Us