- Learn how to build custom Python data connectors and further customize JMP’s Data Connector Framework with the Python Data Connector Demo, available now in the JMP Marketplace!
- See how to create experiments to support product design and ID useful product features. Register for June 12 webinar, 2pm US Eastern Time.
- Subscribe to RSS Feed
- Mark Topic as New
- Mark Topic as Read
- Float this Topic for Current User
- Bookmark
- Subscribe
- Mute
- Printer Friendly Page
Discussions
Solve problems, and share tips and tricks with other JMP users.- JMP User Community
- :
- Discussions
- :
- How to pick data Quantiles in Distribution?

- Mark as New
- Bookmark
- Subscribe
- Mute
- Subscribe to RSS Feed
- Get Direct Link
- Report Inappropriate Content
How to pick data Quantiles in Distribution?
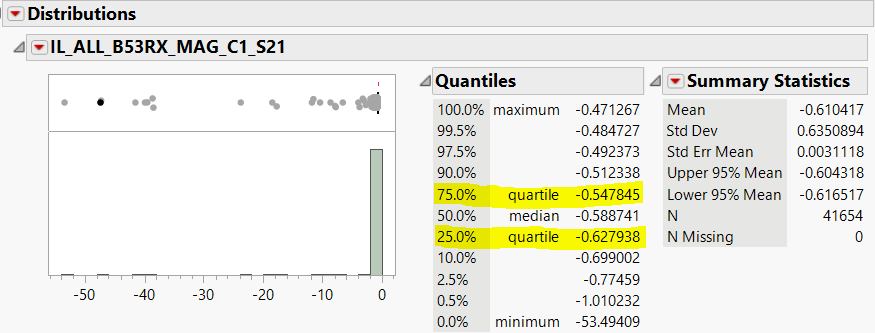
Hello, i'm making the contour plot using the data in Distribution, Quantiles 75% & 25%. My question is how do i put the data Quantiles 75% & 25% in my Minimum Maximum Contour Values? All the data Quantiles is different from another data.
//Put the spec limit on parameter into current data table
Names Default To Here( 1 );
dt = Current Data Table();

// Get the all column names from the data table
columnNames = dt << Get Column Names("String");

// Choose the specific column
cl = New Window("Column Selection", <<Modal,
    HListBox(
		  Panel Box("Make a selection",
			VlistBox(
			  allcolumn = RadioBox(columnNames,
			     prmtr=allcolumn<<get
					)
				)
			)
		)
	);

// If cancel or X was clicked, stop the script
If( cl == {Button( -1 )}, Stop() );


//Open Distribution

col = Column(prmtr);

Distribution(
	Stack( 1 ),
	Arrange in Rows( 2 ),
	Continuous Distribution(
		Column(col),
		Horizontal Layout( 1 ),
		Vertical( 0 )
	)
);


Contour Plot(
	X( :X, :Y ),
	Y(col),
	Show Data Points( 0 ),
	Fill Areas( 1 ),
	Label Contours( 0 ),
	Transform( "Range Normalized" ),
	Specify Contours( Min( -0.627938 ), Max( -0.547845 ), N( 3 ) )
);
Accepted Solutions

- Mark as New
- Bookmark
- Subscribe
- Mute
- Subscribe to RSS Feed
- Get Direct Link
- Report Inappropriate Content
Re: How to pick data Quantiles in Distribution?
You have few different option, you can make a datatable from distribution results and use that to get the values (right click on the table, make into data table and get script from source, edit as neede) or you could use report subscripting to access the table box which has those values
Names Default To Here(1);

dt = Open("$SAMPLE_DATA/Big Class.jmp");

dist = dt << Distribution(
	Stack(1),
	Arrange in Rows(2),
	Continuous Distribution(Column(:height), Horizontal Layout(1), Vertical(0))
);

tb_ref = Report(dist)[OutlineBox("Quantiles"), Table Box(1)];

// not the most robust option
tb_vals = tb_ref << get;
lower_idx = Contains(tb_vals[1], "25.0%");
upper_idx = Contains(tb_vals[1], "75.0%");
q_lower = tb_vals[3][lower_idx];
q_upper = tb_vals[3][upper_idx];

show(q_lower, q_upper);
Some sources for accessing reports:
- Session 7: Scope, Properties and Report Layer
- Introduction to the JMP Scripting Language chapters 5.1 and 5.2
- Scripting Guide: Scripting Guide > Display Trees
- Mark as New
- Bookmark
- Subscribe
- Mute
- Subscribe to RSS Feed
- Get Direct Link
- Report Inappropriate Content
Re: How to pick data Quantiles in Distribution?
Thankyou mate, it work for me use report subscripting.
Recommended Articles
- © 2026 JMP Statistical Discovery LLC. All Rights Reserved.
- Terms of Use
- Privacy Statement
- Contact Us