- Due to inclement weather, JMP support response times may be slower than usual during the week of January 26.
To submit a request for support, please send email to support@jmp.com.
We appreciate your patience at this time. - Register to see how to import and prepare Excel data on Jan. 30 from 2 to 3 p.m. ET.
- Subscribe to RSS Feed
- Mark Topic as New
- Mark Topic as Read
- Float this Topic for Current User
- Bookmark
- Subscribe
- Mute
- Printer Friendly Page
Discussions
Solve problems, and share tips and tricks with other JMP users.- JMP User Community
- :
- Discussions
- :
- Re: How to overlay data points from one group onto the box plots of a second gro...
- Mark as New
- Bookmark
- Subscribe
- Mute
- Subscribe to RSS Feed
- Get Direct Link
- Report Inappropriate Content
How to overlay data points from one group onto the box plots of a second group in graph builder?
I have data from two studies (#1 and #2), each study had four ages of subjects (A, B, C, D) and one continuous result (score). Study #2 also has treatment groups (x, y, z, etc). I am trying to make a graph to compare the two studies. Ideally, the graph includes box plots of age (x-axis) and Score (Y-axis) ONLY FROM STUDY #1. And then overlay the scores from study #2 as individual data points onto the correct box plot for that subject's age. Finally, those data points will be color-coded based on the treatments in study #2. My data sheet has the data from both studies with columns for Study, Subject, Age, Treatment, and Score. I know how to add data points, color codes, etc but I am having trouble making graph builder only pull from study #1 for the box plots and only pull from study #2 for the data points. Do I need to change how my datasheet is set up? Or is there a way to specify in graph builder which rows/variables to include for each section?
Thanks!
(I'm using JMP 16 Pro on Windows)
- Tags:
- windows
Accepted Solutions
- Mark as New
- Bookmark
- Subscribe
- Mute
- Subscribe to RSS Feed
- Get Direct Link
- Report Inappropriate Content
Re: How to overlay data points from one group onto the box plots of a second group in graph builder?
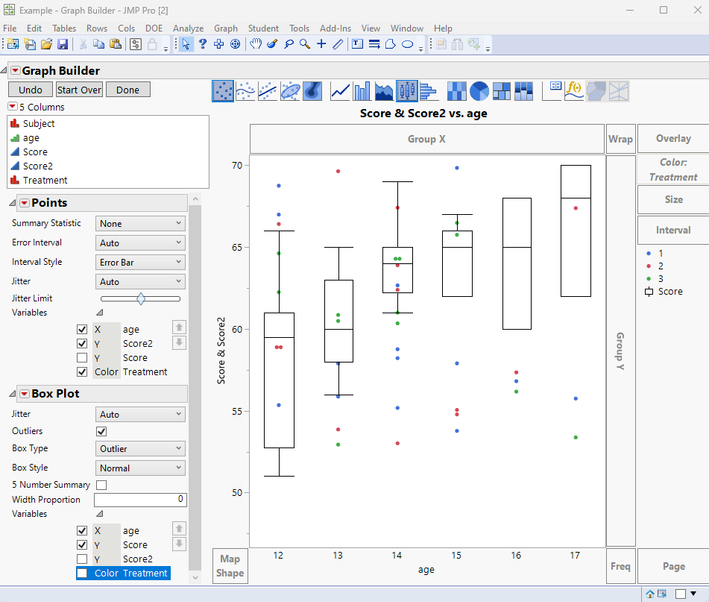
See if this works the way you want.
Basically, I took the first data table, and added a new column that I called Score2, and placed the scores from the second study into that column. I also added a new column Treatment and added in the treatment group for each subject.
To create the graph, I dragged Score and Score2 to the Y axis, and Age to the X axis.
I dragged Treatment to the Color drop area
I then right clicked on the graph and selected Add=>Box Plot
Then I turned to the Properties area on the left for the Control Area.
For the Points, I clicked on the gray triangle next to the Variables listing to open the choices available for the Points and unselected the Score variable, because your request is for the Score values are not to be displayed as points.
For the Box Plot, I opened the choices and unselected Score2 and Color Treatment
- Mark as New
- Bookmark
- Subscribe
- Mute
- Subscribe to RSS Feed
- Get Direct Link
- Report Inappropriate Content
Re: How to overlay data points from one group onto the box plots of a second group in graph builder?
This works great and your explanation was very clear. Thank you!
Recommended Articles
- © 2026 JMP Statistical Discovery LLC. All Rights Reserved.
- Terms of Use
- Privacy Statement
- Contact Us


