- Subscribe to RSS Feed
- Mark Topic as New
- Mark Topic as Read
- Float this Topic for Current User
- Bookmark
- Subscribe
- Mute
- Printer Friendly Page
Discussions
Solve problems, and share tips and tricks with other JMP users.- JMP User Community
- :
- Discussions
- :
- How to optimize factors with uncertainty in 1 step with JMP?
- Mark as New
- Bookmark
- Subscribe
- Mute
- Subscribe to RSS Feed
- Get Direct Link
- Report Inappropriate Content
How to optimize factors with uncertainty in 1 step with JMP?
Hello community!!,
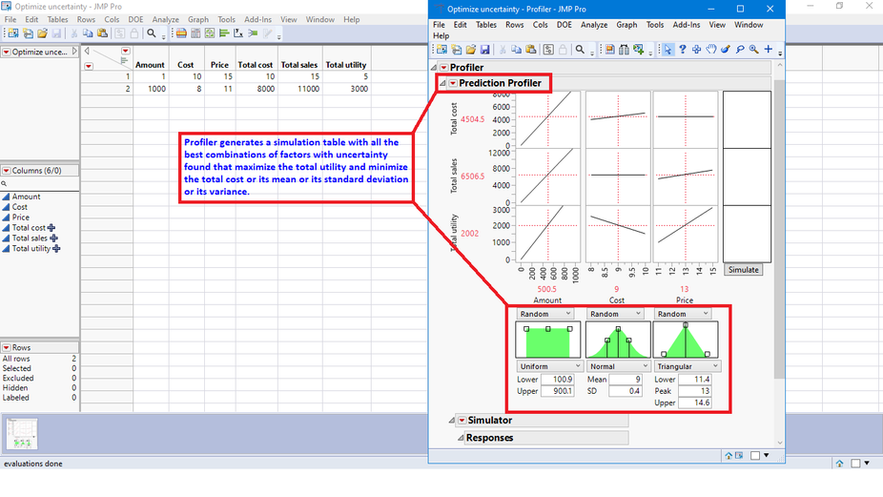
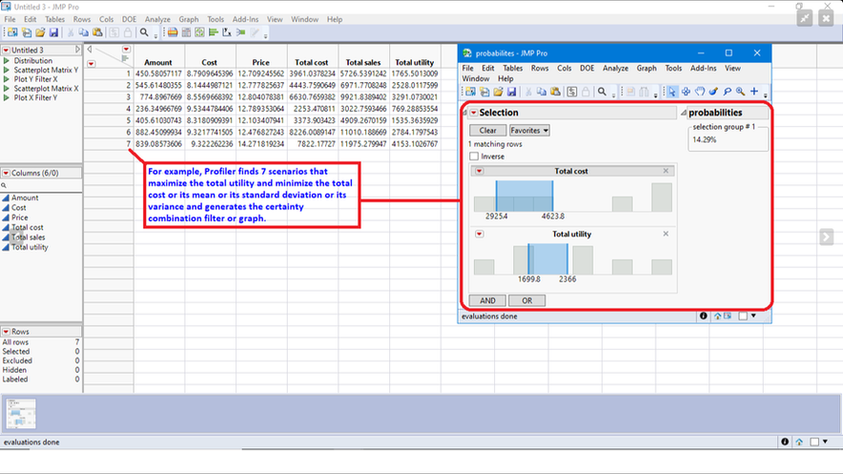
A question: will it be possible for the profiler to find the best combinations of factors with uncertainty when performing a simulation, which maximize the total utility and minimize the total cost, generating a table of the best combinations found? For example:
- Tags:
- windows
- Mark as New
- Bookmark
- Subscribe
- Mute
- Subscribe to RSS Feed
- Get Direct Link
- Report Inappropriate Content
Re: How to optimize factors with uncertainty in 1 step with JMP?
Hello Mark,
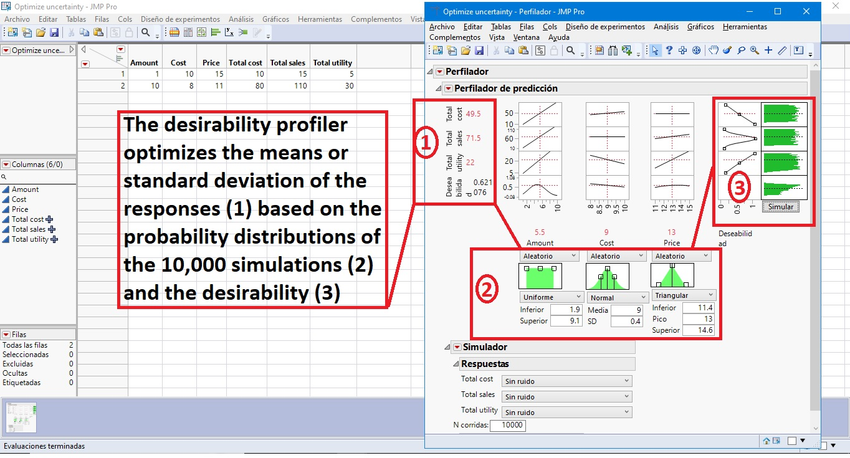
Thank you for your response, a question...will there be a way for JMP to optimize the mean or standard deviation of the responses of the total simulations generated?...that is, for the desirability profiler to use the probability and desirability distributions to find the combination of factors that achieve the desirability.
- Mark as New
- Bookmark
- Subscribe
- Mute
- Subscribe to RSS Feed
- Get Direct Link
- Report Inappropriate Content
Re: How to optimize factors with uncertainty in 1 step with JMP?
The
I guess one can use the same formulas, change the algorithm and use it for your task as well?
- Mark as New
- Bookmark
- Subscribe
- Mute
- Subscribe to RSS Feed
- Get Direct Link
- Report Inappropriate Content
Re: How to optimize factors with uncertainty in 1 step with JMP?
The Bayesian optimization plugin is an interesting alternative for 1 objective and it would be better if it could optimize multiple objectives.
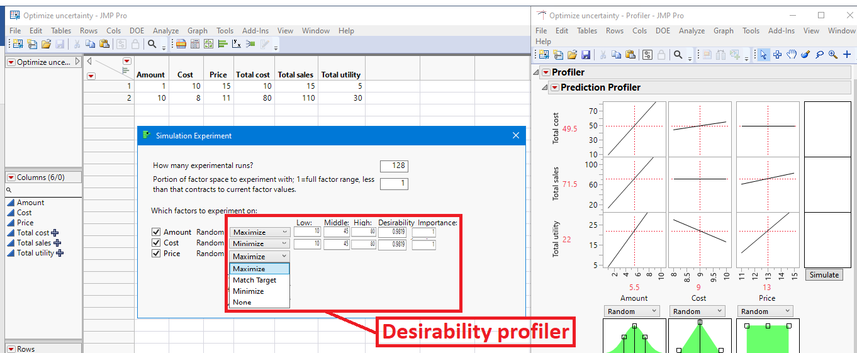
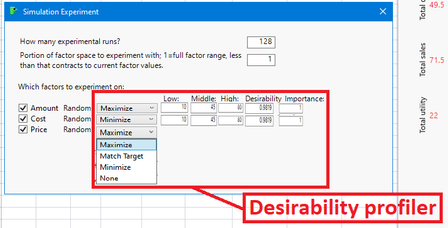
In relation to the simulation experiment, the desirability profiler should be included as an option so that in a single step it optimizes the mean responses or standard deviations or values and generates a table with the best responses found.
The idea I'm referring to is a plugin something like this:
- Mark as New
- Bookmark
- Subscribe
- Mute
- Subscribe to RSS Feed
- Get Direct Link
- Report Inappropriate Content
Re: How to optimize factors with uncertainty in 1 step with JMP?
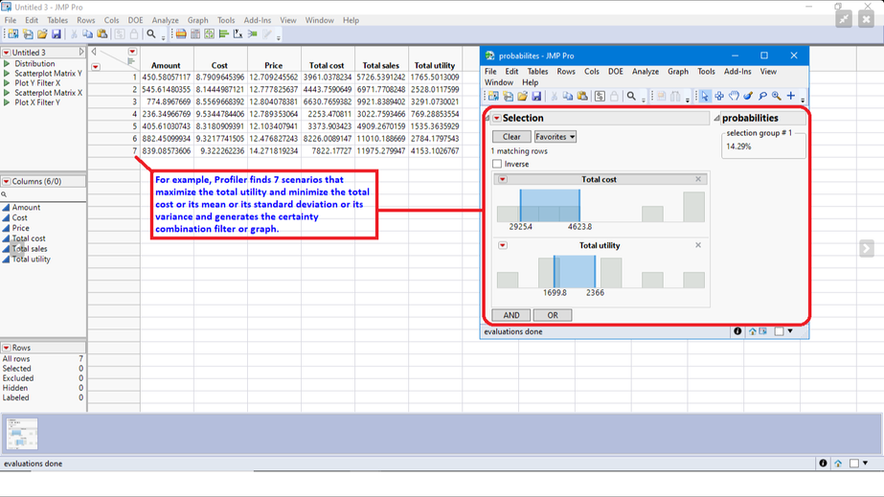
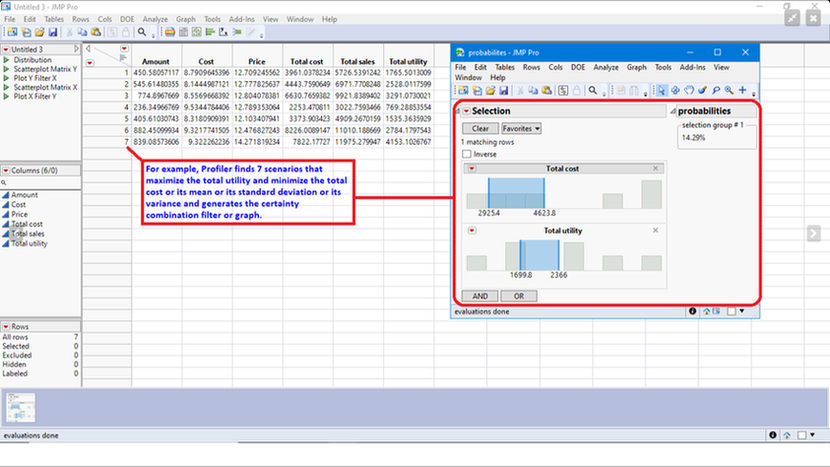
And generate a table with the best 1 or 2 or 3 or xxx results found of the mean or standard deviation or the value, for example:
- Mark as New
- Bookmark
- Subscribe
- Mute
- Subscribe to RSS Feed
- Get Direct Link
- Report Inappropriate Content
Re: How to optimize factors with uncertainty in 1 step with JMP?
How to link these 2 kinds of simulations?
1) you have a model which you trust - and you have some variations of the input parameters. Then one can find the optimal setting of the input parameters to optimize the outcome - specified by desirability. This approach neglects any uncertainties of the model.
2) with a specific setting of the input parameters, one performs experiments. But the model is not 100% nailed down: You invest at the stock market, you have some model about the possible outcome, but the outcome is not 100% clear yet. This leads to a certain spread of the possible resulting values - an uncertainty.
The second approach can be simulated by adding some additional parameters with variation. The variation of the factor settings is irrelevant for the optimization, but the variation of such additional factors isn't. Is it possible to keep such input factors fluctuating for the Optimization step, to weight the (un)certainty of the predicted value as part of the desirability?
@Mark_Bailey wrote:With the desirability defined, click the red triangle next to Prediction Profiler and select Optimization and Desirability > Maximize Desirability. The variation in the factor settings is irrelevant to the search for the optimum factor settings.
- Mark as New
- Bookmark
- Subscribe
- Mute
- Subscribe to RSS Feed
- Get Direct Link
- Report Inappropriate Content
Re: How to optimize factors with uncertainty in 1 step with JMP?
Hello Hogi,
I couldn't understand your answer (Google Translate), a question....
Will there be a JMP script or plugin that incorporates the desirability profiler into the simulation experiment platform?
And generate a table with the best 1 or 2 or 3 or xxx results found of the mean or standard deviation or the value, for example:
- « Previous
- Next »
Recommended Articles
- © 2026 JMP Statistical Discovery LLC. All Rights Reserved.
- Terms of Use
- Privacy Statement
- Contact Us
