Turn on suggestions
Auto-suggest helps you quickly narrow down your search results by suggesting possible matches as you type.
Options
- Subscribe to RSS Feed
- Mark Topic as New
- Mark Topic as Read
- Float this Topic for Current User
- Bookmark
- Subscribe
- Mute
- Printer Friendly Page
Discussions
Solve problems, and share tips and tricks with other JMP users.- JMP User Community
- :
- Discussions
- :
- How to loop through column and plot variability chart
- Mark as New
- Bookmark
- Subscribe
- Mute
- Subscribe to RSS Feed
- Get Direct Link
- Report Inappropriate Content
How to loop through column and plot variability chart
Created:
Feb 28, 2022 11:50 PM
| Last Modified: Jun 10, 2023 4:44 PM
(1483 views)
Hi, Need help here :'(
I want to create a universal script that would enable me to plot the same var chart with different column output.
For example:
I have two table
Table 1
| Link | force | temp | pressure | level |
| 1 | 50 | 88 | 2 | - |
| 2 | 60 | 70 | 1 | - |
| 3 | 40 | 89 | 3 | - |
| 4 | 50 | 88 | 1 | - |
Table 2
| Link | force | temp | pressure | time | level |
| 1 | 50 | 88 | 2 | 5 | 3 |
| 2 | 60 | 70 | 1 | 6 | 4 |
| 3 | 40 | 89 | 3 | 15 | 5 |
| 4 | 50 | 88 | 1 | 4 | 4 |
My Var chart would be :
X (:Link)
Y (:force, :temp, :pressure, :time, :level)
How do i create a script that can still plot both var chart in both table eventhough table 1 is missing some column?
2 REPLIES 2
- Mark as New
- Bookmark
- Subscribe
- Mute
- Subscribe to RSS Feed
- Get Direct Link
- Report Inappropriate Content
Re: How to loop through column and plot variability chart
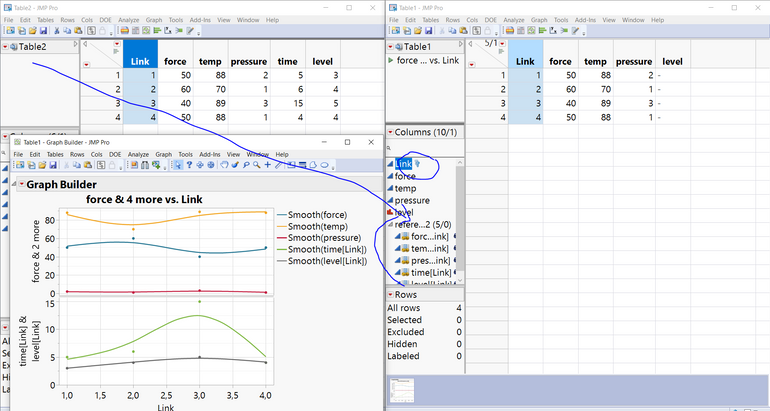
This is one way how it could work:
Virtually link both tables (e.g. Table1 contains references to Table2 columns),
and generate the graph.
Tested with JMP16 on Win10.
Names Default To Here( 1 );

dt1 = New Table( "Table1",
	Add Rows( 4 ),
	Compress File When Saved( 1 ),
	New Column( "Link", Numeric, "Continuous", Format( "Best", 12 ), Set Selected, Set Values( [1, 2, 3, 4] ) ),
	New Column( "force", Numeric, "Continuous", Format( "Best", 12 ), Set Values( [50, 60, 40, 50] ) ),
	New Column( "temp", Numeric, "Continuous", Format( "Best", 12 ), Set Values( [88, 70, 89, 88] ) ),
	New Column( "pressure", Numeric, "Continuous", Format( "Best", 12 ), Set Values( [2, 1, 3, 1] ) ),
	New Column( "level", Character( 16 ), "Nominal", Set Values( {"-", "-", "-", "-"} ) )
);

dt2 = New Table( "Table2",
	Add Rows( 4 ),
	Compress File When Saved( 1 ),
	New Column( "Link", Numeric, "Continuous", Format( "Best", 12 ), Set Selected, Set Values( [1, 2, 3, 4] ) ),
	New Column( "force", Numeric, "Continuous", Format( "Best", 12 ), Set Values( [50, 60, 40, 50] ) ),
	New Column( "temp", Numeric, "Continuous", Format( "Best", 12 ), Set Values( [88, 70, 89, 88] ) ),
	New Column( "pressure", Numeric, "Continuous", Format( "Best", 12 ), Set Values( [2, 1, 3, 1] ) ),
	New Column( "time", Numeric, "Continuous", Format( "Best", 12 ), Set Values( [5, 6, 15, 4] ) ),
	New Column( "level", Numeric, "Continuous", Format( "Best", 12 ), Set Values( [3, 4, 5, 4] ) )
);

// to get link working, save is needed
dt1 << save( "$TEMP\" || (dt1 << get name()) || ".jmp" );
dt2 << save( "$TEMP\" || (dt2 << get name()) || ".jmp" );

dt2:LInk << set property( "Link ID", 1 );
dt1:Link << set Property( "Link Reference", {Reference Table( dt2 )} );

dt1 << Add Properties to Table(
	{New Script(
		"force & 4 more vs. Link",
		Graph Builder(
			Size( 514, 444 ),
			Show Control Panel( 0 ),
			Graph Spacing( 5 ),
			Variables(
				X( :Link ),
				Y( :force ),
				Y( :temp, Position( 1 ) ),
				Y( :pressure, Position( 1 ) ),
				Y( Referenced Column( "time[Link]", Reference( Column( :Link ), Reference( Column( :time ) ) ) ) ),
				Y( Referenced Column( "level[Link]", Reference( Column( :Link ), Reference( Column( :level ) ) ) ), Position( 2 ) )
			),
			Elements( Position( 1, 1 ), Points( X, Y( 1 ), Y( 2 ), Y( 3 ), Legend( 65 ) ), Smoother( X, Y( 1 ), Y( 2 ), Y( 3 ), Legend( 66 ) ) ),
			Elements( Position( 1, 2 ), Points( X, Y( 1 ), Y( 2 ), Legend( 67 ) ), Smoother( X, Y( 1 ), Y( 2 ), Legend( 68 ) ) )
		)
	)}
);

dt1 << run script( "force & 4 more vs. Link" );
Georg
- Mark as New
- Bookmark
- Subscribe
- Mute
- Subscribe to RSS Feed
- Get Direct Link
- Report Inappropriate Content
Re: How to loop through column and plot variability chart
Welcome to the community!
Given these 2 tables, that have different columns
The following script will work for both
Names Default To Here( 1 );
dt = Current Data Table();

// get the column names for the columns in the current data table
colNames = dt << get column names( string );

// Remove the column called Link from the list
Try( Remove From( colNames, Contains( colNames, "Link" ), 1 ) );

// Run the chart
Variability Chart( Y( Eval( colNames ) ), X( :Link ), Std Dev Chart( 0 ) );
Here is the result of the script
Jim
Recommended Articles
- © 2026 JMP Statistical Discovery LLC. All Rights Reserved.
- Terms of Use
- Privacy Statement
- Contact Us


