- Subscribe to RSS Feed
- Mark Topic as New
- Mark Topic as Read
- Float this Topic for Current User
- Bookmark
- Subscribe
- Mute
- Printer Friendly Page
Discussions
Solve problems, and share tips and tricks with other JMP users.- JMP User Community
- :
- Discussions
- :
- How to get axis labels to the left of x-axis
- Mark as New
- Bookmark
- Subscribe
- Mute
- Subscribe to RSS Feed
- Get Direct Link
- Report Inappropriate Content
How to get axis labels to the left of x-axis
I made a scatter plot with three variables on the x axis as shown below, but the label for the the axes (xC/ xB / xA) are at the bottom which can be unintuitive.
I was looking a way to get the labels for the x axis to the left of each x-axis i.e xA on the left of "A1 A2 A1 A2...", xB on the left of "B1 B2...." and so on, so that it forms sort of a hierarchical table.
(I am new to jump, so not sure abut the correct terms for everything.)
Thanks in advance
- Tags:
- windows
- Mark as New
- Bookmark
- Subscribe
- Mute
- Subscribe to RSS Feed
- Get Direct Link
- Report Inappropriate Content
Re: How to get axis labels to the left of x-axis
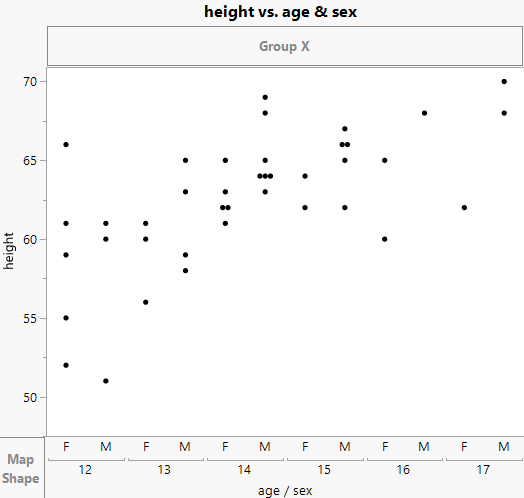
Is this what you are trying to do?
If so, in Graph Builder, you just drag the Age column to the X axis, then go back and drag the Sex column to the right end of the X axis
- Mark as New
- Bookmark
- Subscribe
- Mute
- Subscribe to RSS Feed
- Get Direct Link
- Report Inappropriate Content
Re: How to get axis labels to the left of x-axis
Thank you for the reply.
I already have the graph plotted correctly, I want to change only the formatting of the x-axis labels as I have shown in red text here:
- Mark as New
- Bookmark
- Subscribe
- Mute
- Subscribe to RSS Feed
- Get Direct Link
- Report Inappropriate Content
Re: How to get axis labels to the left of x-axis
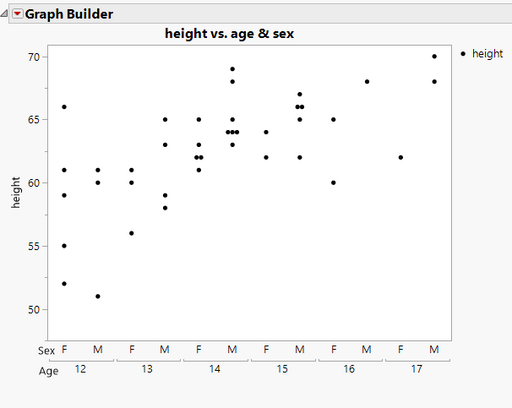
I was able to accomplish this interactively and then I had JMP save the JSL to a script window, which gave me the JSL that can be used to produce the graph. As can be seen in the below graph, I only have 2 levels on my X axis, not 3 as in your example, however the method I used can be easily extended for the 3 levels.
- I created the default graph
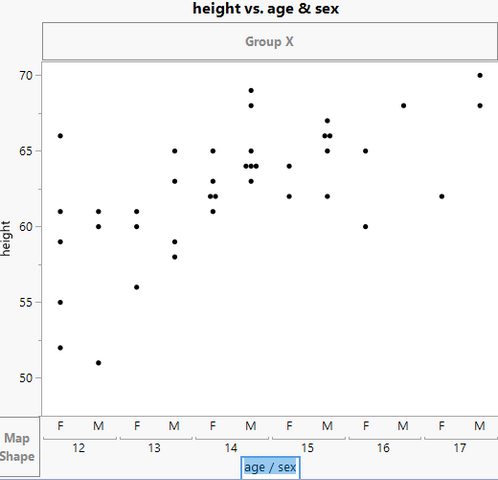
- To remove the axis label, I clicked on the age / sex to edit it, and used the Backspace key to delete it.
-
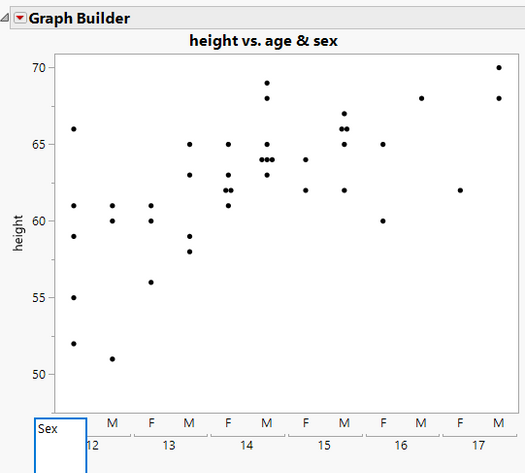
Next I used the Annotate Tool
to add the Sex label
-
After it is entered the mouse can be used to position it exactly where it is wanted.
-
I then repeated the same step to add the Age label.. The first graph displayed is what the final results were.
-
The last step was to go to the red triangle and select Save Script=>To Script Window
Graph Builder(
	Size( 525, 458 ),
	Show Control Panel( 0 ),
	Variables( X( :age ), X( :sex, Position( 1 ) ), Y( :height ) ),
	Elements( Points( X( 1 ), X( 2 ), Y, Legend( 3 ) ) ),
	SendToReport(
		Dispatch( {}, "X title", TextEditBox, {Set Text( "" )} ),
		Dispatch(
			{},
			"",
			AxisBox,
			{Add Axis Label( "Sex" ),
			{Add Text Annotation(
				Text( "Sex" ),
				Fixed Size( 0 ),
				Text Box( {-16, 2, 21, 29} ),
				Filled( 0 )
			), Add Text Annotation(
				Text( "Age" ),
				Fixed Size( 0 ),
				Text Box( {-15, 26, 26, 53} ),
				Filled( 0 )
			)}}
		),
		Dispatch( {}, "Sex", TextEditBox, {Set Text( "" )} )
	)
);
By repeating the Annotate step for your 3rd X axis level, and then saving the script should give you the JSL you need for your graph.
Recommended Articles
- © 2026 JMP Statistical Discovery LLC. All Rights Reserved.
- Terms of Use
- Privacy Statement
- Contact Us


