- New to JMP? Join us Sept. 23-24 for the Early User Edition of Discovery Summit, tailor-made for new users. Register now for free!
- Use World Cup data to build models, explore spatial relationships, and create informative visualizations in JMP. Register. July 17, 2 pm US Eastern Time.
- Your voice matters! Tell us how you prefer to receive JMP updates, so we can tailor our communication to your needs. Take short survey.
- Subscribe to RSS Feed
- Mark Topic as New
- Mark Topic as Read
- Float this Topic for Current User
- Bookmark
- Subscribe
- Mute
- Printer Friendly Page
Discussions
Solve problems, and share tips and tricks with other JMP users.- JMP User Community
- :
- Discussions
- :
- Re: How to do a Repeated Measures ANOVA

- Mark as New
- Bookmark
- Subscribe
- Mute
- Subscribe to RSS Feed
- Get Direct Link
- Report Inappropriate Content
How to do a Repeated Measures ANOVA
How do I set up the file and run a repeated measures ANOVA in jmp?
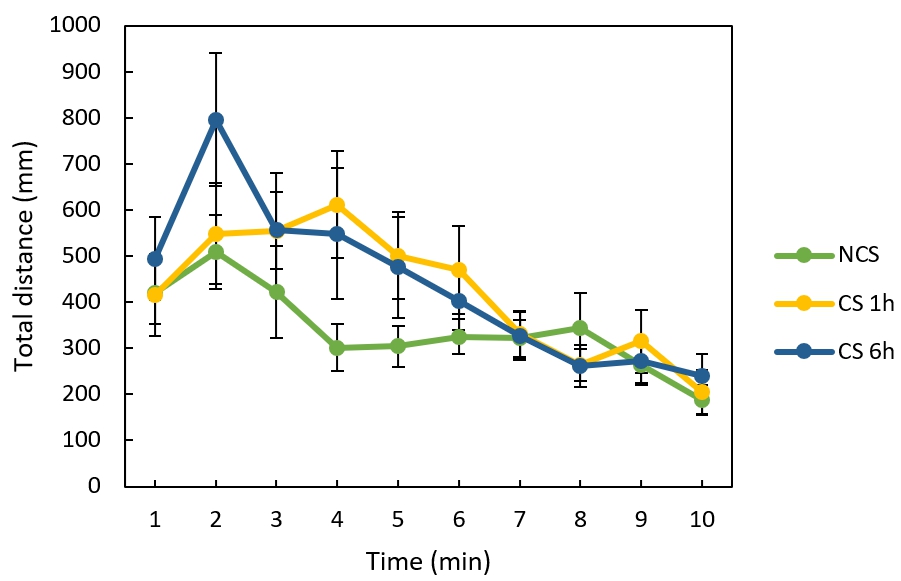
I did an experiment where I tracked distance animals traveled over time for three treatments (NCS n=25; CS1 n=24; CS6 n=25). I took the average distance for each group for each 1min period and graphed it for my three treatment groups. I would like to do a repeated measures ANOVA but am unsure how to set this up in jmp and run it. I think I would use the raw data instead of the average and do a new test for each 1 min interval. But something tells me I need to all the data for the whole graph in the jmp file at the same time.
I want to know if my two treatment groups (CS1h and CS6h) are different from my control (NCS). I would like to know if the line in total is different and also if each individual time point is different. I looked in the literature and it seems the repeated measures ANOVA is the stat to do.
I'm also not sure since some of my animals traveled 0 millimetres during a certain min, if that will be a problem with the stats.
I'm relatively new to jmp and couldn't find a tutorial for a repeated measures ANOVA, so I'm not sure what buttons to push. Any help would be appreciated. I've attached files and pictures.

- Mark as New
- Bookmark
- Subscribe
- Mute
- Subscribe to RSS Feed
- Get Direct Link
- Report Inappropriate Content
Re: How to do a Repeated Measures ANOVA
Kat, Some questions/comments...You have each treatment "run" multiple times. Are these multiple animals? Or the same animal "run" over different time periods? These are possibly independent events and so can be used in the model. It looks like you averaged these? Why? Did you look at the within treatment variation before you averaged them? And always look for unusual data points before summarizing.
Regarding the repeat data points, here are my thoughts:
1. The question of repeats always has to do with what the treatments were doing. If the treatment combination was the same and you have multiple data points, then, typically these are repeats. These should not be considered independent events. If the treatments change between data points, we call those experimental units and can be treated a independent events.
2. The question of what to do with the multiple data points has no definitive answer. It depends on what you want those data points to describe, quantitatively. Here are some possibilities:
- Take the average of the data (over the 10 minutes). This describes the central tendency of the 10 minutes of data.
- Take the standard deviation of the data. This describes variability related to the 10 minutes.
- Take the Min or Max values. Possibly to look at extremes of the treatment.
- Take the slope a the line through the data. This might describe the rate of change.
3. In order to get summary statistics, you can stack the 10 min columns and then summarize the stacked column by treatment.
I attached the stacked and summarized data tables.
- Mark as New
- Bookmark
- Subscribe
- Mute
- Subscribe to RSS Feed
- Get Direct Link
- Report Inappropriate Content
Re: How to do a Repeated Measures ANOVA
Thank you for explaining all that and helping me with my data. To answer your questions..
You have each treatment "run" multiple times. Are these multiple animals? Or the same animal "run" over different time periods?
I placed one animal into an arena for 10mins and tracked its locomotion. For example, animal1 traveled 196mm during the first minute and between min1 and min2 animal1 traveled 1595mm, ect. So each data point is a sum of the milimeters traveled during that 1min time frame. For the NCS treatment group I had 24 different animals that received the same treatment. For the CS1 treatment group I had 24 different animals that received that treatment. For the CS6 treatment group I had 25 different animals. So the treatment combination was the same and have multiple data points so these are repeats, as you said.
It looks like you averaged these? Why?
I’m not that interested in the individuals. I’m most interested in how the treatment affects locomotion. So that is why I averaged them so I could compare across treatment groups. These seems to be what others in the field are publishing in the literature. (For example: Figure 4 in Lind et al 2005 Validation of a digital video tracking system for recording pig locomotor behaviour)
Did you look at the within treatment variation before you averaged them?
I know there is quite a bit of variation within a treatment group, which is why I have pretty large error bars. I also know that my data is not normally distributed which is why I considered doing a Freedman’s Rank test. However, others in the literature did a repeated measures ANOVA or at least some sort of ANOVA that they didn’t specify (For example: Figure 2B in Martin 2004 A portrait of locomotor behaviour in Drosophila determined by a video-tracking paradigm) I figured that since my sample size was over 20 it would be okay to do a parametric test instead of a non-parametric test (Freedman’s Rank). Do you agree?
And always look for unusual data points before summarizing.
I know that during some minutes a given animal might not move at all (0mm traveled). This makes for large max/mins and large error bars but since it occurred in all treatment groups, I figured it was okay to average the data for each treatment group for each minute.
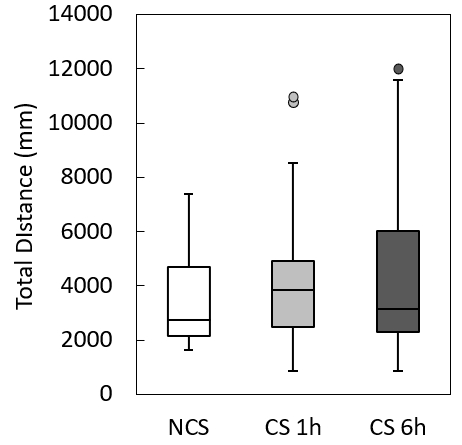
Average the data across 10min: I have a different graph that captures this idea (attached box and whisker plot)
Standard Deviation: I don’t report this number but I did show the SEM in my error bars
Min & Max: I show this in my box and whisker plot which is separate from the line graph I’m working on now
Slope of the line: I think this would be interesting to look into since it appears that across all groups animals tend to move less as time goes on. I would probably have to find the best fit line.
Thank you for showing me how to set up my data in the stacked document you sent me. That was very helpful.
“JMP offers multiple methods to analyze repeated measures: a multivariate repeated-measures approach, a univariate split-plot approach, and an additional capability through JMP® Pro to perform such an analysis with the Mixed Model personality within the Fit Model platform.” I’m not sure which of these methods to use. It looks like the Full-Factorial-Repeated Measures ANOVA add in might be helpful if you know what you are doing. I plan to learn how to use it since I have 35 more graphs very similar to this one that I need to do stats for.
Thank you so much for all your help. I really appreciate it.

- Mark as New
- Bookmark
- Subscribe
- Mute
- Subscribe to RSS Feed
- Get Direct Link
- Report Inappropriate Content
Re: How to do a Repeated Measures ANOVA
To add to statman's excellent feedback that gives you a great primer on repeated measure analysis, I would suggest that you look into the following Add-In that greatly simplifies the implementation of repeated measure ANOVA in JMP:
https://community.jmp.com/t5/JMP-Add-Ins/Full-Factorial-Repeated-Measures-ANOVA-Add-In/ta-p/23904
Remember that this tool is only useful if you have a clear understanding of the nature of your model.
Best,
TS

- Mark as New
- Bookmark
- Subscribe
- Mute
- Subscribe to RSS Feed
- Get Direct Link
- Report Inappropriate Content
Re: How to do a Repeated Measures ANOVA
This question is common. Please read this JMP Technical Note about repeated measures.
Recommended Articles
- © 2026 JMP Statistical Discovery LLC. All Rights Reserved.
- Terms of Use
- Privacy Statement
- Contact Us