- Don’t miss your chance to experience Discovery Summit Europe at our best available rate! Early bird registration through 31 Oct.
- Graph Builder Toolbar streamlines interactive graphing. Creates shortcuts on Report and GraphBuilder Helpers toolbars. Download and install the extension.
- Subscribe to RSS Feed
- Mark Topic as New
- Mark Topic as Read
- Float this Topic for Current User
- Bookmark
- Subscribe
- Mute
- Printer Friendly Page
Discussions
Solve problems, and share tips and tricks with other JMP users.- User Community
- :
- Discussions
- :
- How to determine differences between each pair of categorical data with 3+ group...

- Mark as New
- Bookmark
- Subscribe
- Mute
- Subscribe to RSS Feed
- Get Direct Link
- Report Inappropriate Content
How to determine differences between each pair of categorical data with 3+ groups
Hi!
I feel my question is pretty straight forward. How can I determine differences between each pair of categorical data with 3+ groups?
I have two categorical variables:
1) Type of Grant (Grant 1, Grant 2, Grant 3, & Grant 4)
2) Professorship (Assistant professor, associate professor, full professor)
I can use Fit Y by X and get a significant Chi Square value between the two.... But how can I tell where this differences lies? For example, how do I know if grant 3 is significantly more likely to have associate professors compared to grant 2, or that grant 1 is significantly more likely to have full professors than all of the other grants?
If I make professorship a numerical variable, I can get comparisons and a p value for each pair, is this how it should be done?
Thanks in advance.
Accepted Solutions


- Mark as New
- Bookmark
- Subscribe
- Mute
- Subscribe to RSS Feed
- Get Direct Link
- Report Inappropriate Content
Re: How to determine differences between each pair of categorical data with 3+ groups
Click the red triangle next to Contingency and select Correspondence Analysis.You only have two variables so it reduces to a one-dimensional plot. You will see the association between levels.
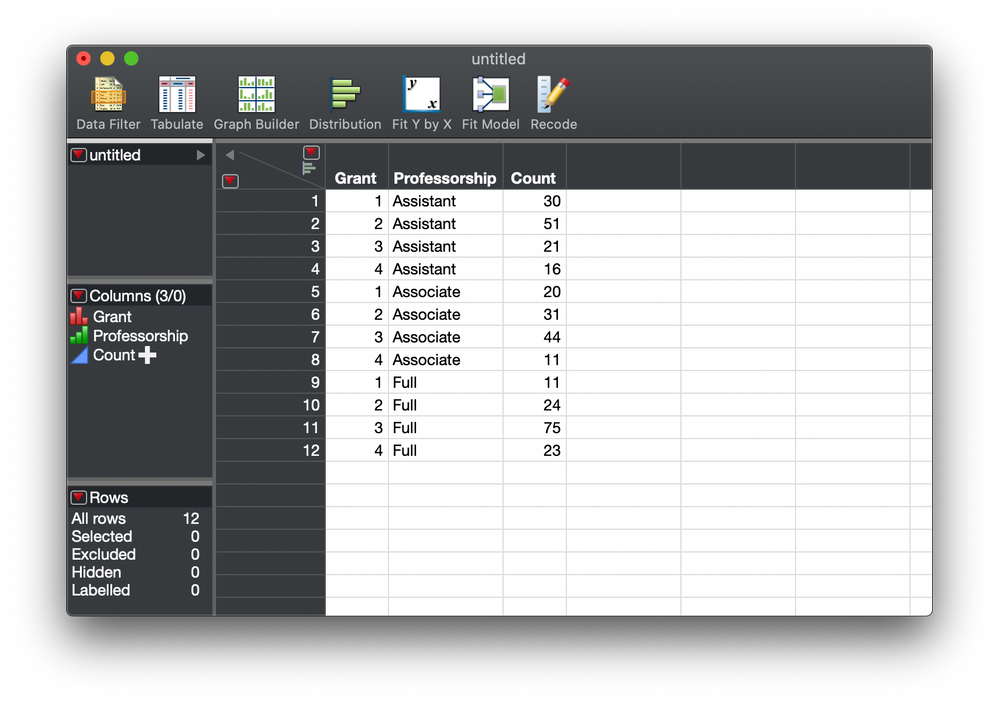
Here is mock data to illustrate.
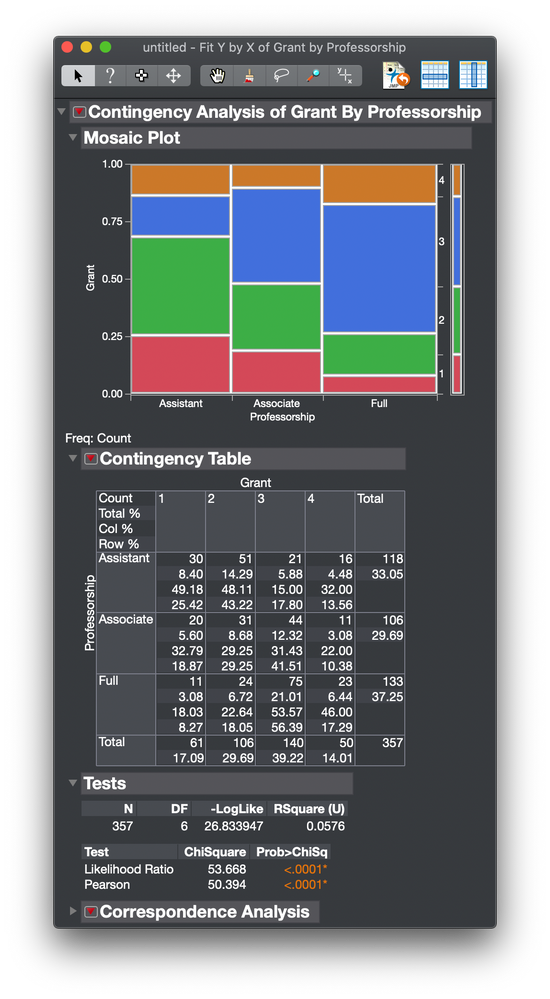
Here is the initial analysis as you describe.
Here is the addition of the correspondence analysis.
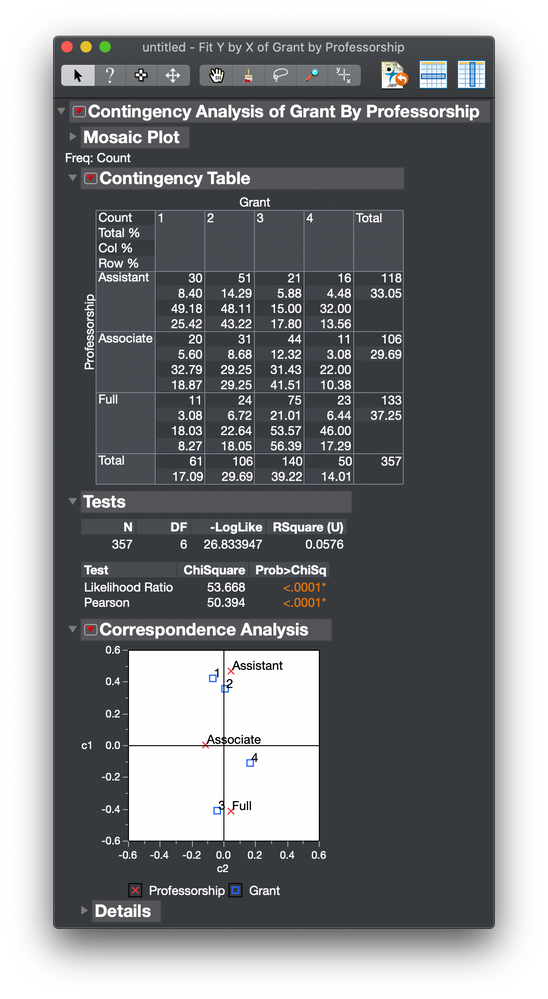
So in this mock up, Assistant is associated with Grants 1 and 2, Associate is associated with Grant 4, and Full is associated with Grant 3.
You can read more about correspondence analysis in Help > JMP Documentation Library > Basic Analysis guide > Contingency Analysis chapter.
Note that there is a richer platform, Analyze > Multivariate Methods > Multiple Correspondence Analysis available. It is described in Help > JMP Documentation Library > Multivariate Methods guide > Multiple Correspondence Analysis chapter
- Mark as New
- Bookmark
- Subscribe
- Mute
- Subscribe to RSS Feed
- Get Direct Link
- Report Inappropriate Content
Re: How to determine differences between each pair of categorical data with 3+ groups
Click the red triangle next to Contingency and select Correspondence Analysis.You only have two variables so it reduces to a one-dimensional plot. You will see the association between levels.
Here is mock data to illustrate.
Here is the initial analysis as you describe.
Here is the addition of the correspondence analysis.
So in this mock up, Assistant is associated with Grants 1 and 2, Associate is associated with Grant 4, and Full is associated with Grant 3.
You can read more about correspondence analysis in Help > JMP Documentation Library > Basic Analysis guide > Contingency Analysis chapter.
Note that there is a richer platform, Analyze > Multivariate Methods > Multiple Correspondence Analysis available. It is described in Help > JMP Documentation Library > Multivariate Methods guide > Multiple Correspondence Analysis chapter
Recommended Articles
- © 2026 JMP Statistical Discovery LLC. All Rights Reserved.
- Terms of Use
- Privacy Statement
- Contact Us