- Learn how to build custom Python data connectors and further customize JMP’s Data Connector Framework with the Python Data Connector Demo, available now in the JMP Marketplace!
- See how to create experiments to support product design and ID useful product features. Register for June 12 webinar, 2pm US Eastern Time.
- Subscribe to RSS Feed
- Mark Topic as New
- Mark Topic as Read
- Float this Topic for Current User
- Bookmark
- Subscribe
- Mute
- Printer Friendly Page
Discussions
Solve problems, and share tips and tricks with other JMP users.- JMP User Community
- :
- Discussions
- :
- Re: How to create stable wafer maps indicating the flat

- Mark as New
- Bookmark
- Subscribe
- Mute
- Subscribe to RSS Feed
- Get Direct Link
- Report Inappropriate Content
How to create stable wafer maps indicating the flat
Hi,
I am triying to create a wafer map and indicate the position of the flat.
I managed to create the map but using the function "Path" to create the wafer borders was not successful...So I tried to use the function "Circle" and cut it where the flat should be.
The outcome is shown in the right picture below.
There 2 instabilities:
1/ the circle seems to scale differently from the window itself !
2/ When I try to save the picture using the "save picture" function, the wafer borders shift (see left picture below) !
My questions:
1/ Is there a way to have the wafer border including the flat in a simple and stable way when saving the picture ?
2/ Is it also possible to have it tied to the XCoord and Ycoord ? (meaning stable towards window scaling ?).
Please find attached the data table (ShotMap_Test.jmp) and the table needed to create the map (WaferMap.jmp).
Attached also the script I used (it is also attached to the data table)
Many thanks in advance.
Accepted Solutions

- Mark as New
- Bookmark
- Subscribe
- Mute
- Subscribe to RSS Feed
- Get Direct Link
- Report Inappropriate Content
Re: How to create stable wafer maps indicating the flat
Some things I'm doing differently:
- Using the Isometric sizing in the frame box to ensure the data points are square.
- Using an Expression() and Substitute into() to calculate and hard code the values into the script based on the actual data.
In your code, it looks like if you change the frame size or axis things are going to get weird. The strategies I used above make the script static and tied to the scale of the data. So you can change things in the graph and it should distort everything the same.
I hope that helps.
- Mark as New
- Bookmark
- Subscribe
- Mute
- Subscribe to RSS Feed
- Get Direct Link
- Report Inappropriate Content
Re: How to create stable wafer maps indicating the flat
Have a look at the annotate capability of the semiconductor toolkit. Semiconductor Toolkit
If it's not doing what you need add a comment there and we can see what's missing.
Best,
M
- Mark as New
- Bookmark
- Subscribe
- Mute
- Subscribe to RSS Feed
- Get Direct Link
- Report Inappropriate Content
Re: How to create stable wafer maps indicating the flat
It looks indeed nice, but I am stuck with JMP11 (and it will be for a couple of more months).
Is it possible to get a hint on how to draw in a stable way the wafer borders ?
- Mark as New
- Bookmark
- Subscribe
- Mute
- Subscribe to RSS Feed
- Get Direct Link
- Report Inappropriate Content
Re: How to create stable wafer maps indicating the flat
It should run just fine on JMP11, but you'll need to make a small change in the Add-in to install it. Here's the procedure:
- Download the Add-in.
- In JMP select File > Open, and navigate to the add-in.
- Select it and select "Edit after open" in the options (this is under the options panel in MacOS and the little gray triangle menu on the open button on windows).
- Once you're in the add-in, just change the "Minimum JMP Version" to 11 and save it. This should also install it. If not just open the add-in as normal without step 3.
The Annotate Tool isn't doing anything too fancy, so I think it should behave with v11. I can't be sure as I don't have v11 set up at the moment. You might run into issues with some of the other tools, though. Also, while you have it open you can look at the files and scripts to see what I'm doing in there which may give you some hints as to where you're hitting issues.
Best,
M
- Mark as New
- Bookmark
- Subscribe
- Mute
- Subscribe to RSS Feed
- Get Direct Link
- Report Inappropriate Content
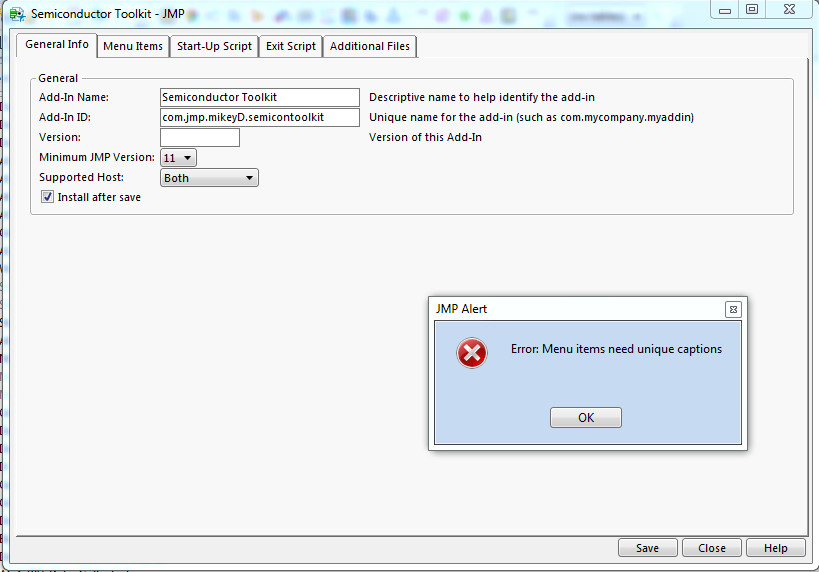
Re: How to create stable wafer maps indicating the flat
I tried indeed, but it does not work (see attached a snapshot of the error-message).
- Mark as New
- Bookmark
- Subscribe
- Mute
- Subscribe to RSS Feed
- Get Direct Link
- Report Inappropriate Content
Re: How to create stable wafer maps indicating the flat
Here you go... Try this.
- Mark as New
- Bookmark
- Subscribe
- Mute
- Subscribe to RSS Feed
- Get Direct Link
- Report Inappropriate Content
Re: How to create stable wafer maps indicating the flat
Thanks a lot M_Anderson,
It works now !
I see your add-in contains a much advanced code than what I am compiling :)
I went through it and see already a few interesting points...
I see you also use "Circle" to draw the wafer edge. One question: How do you make sure the radius of the circle is resized correctly when the widow size changes (in other words: how to link the radius to the window dimensions ?).
I used the following code but it does not do the job:
// Calculate the center of the circle
Report( Biv )[Framebox( 1 )] << add graphics script(
	x1 = (Col Min( WaferMap:X ) + Col Max( WaferMap:X )) / 2;
	y1 = (Col Min( WaferMap:Y ) + Col Max( WaferMap:Y )) / 2;
// Calculate the radius
	{r1, r2} = Report( Biv )[Framebox( 1 )] << Get Size();
	radius = (r1 + r2) / 26.5;
	Biv << reshow;
	Pen Size( 2 );
	Circle( {x1, y1}, radius );

);
- Mark as New
- Bookmark
- Subscribe
- Mute
- Subscribe to RSS Feed
- Get Direct Link
- Report Inappropriate Content
Re: How to create stable wafer maps indicating the flat
Some things I'm doing differently:
- Using the Isometric sizing in the frame box to ensure the data points are square.
- Using an Expression() and Substitute into() to calculate and hard code the values into the script based on the actual data.
In your code, it looks like if you change the frame size or axis things are going to get weird. The strategies I used above make the script static and tied to the scale of the data. So you can change things in the graph and it should distort everything the same.
I hope that helps.
Recommended Articles
- © 2026 JMP Statistical Discovery LLC. All Rights Reserved.
- Terms of Use
- Privacy Statement
- Contact Us