- Don’t miss your chance to experience Discovery Summit Europe at our best available rate! Early bird registration through 31 Oct.
- Image to Table JMP extension imports single or batch images as data tables. Useful to extract curves from pictures or convert image data to curve data to use in analyses like Functional Data Explorer. Download and install the extension.
- Subscribe to RSS Feed
- Mark Topic as New
- Mark Topic as Read
- Float this Topic for Current User
- Bookmark
- Subscribe
- Mute
- Printer Friendly Page
Discussions
Solve problems, and share tips and tricks with other JMP users.- User Community
- :
- Discussions
- :
- How to create a calculated column similar to pivot table in Excel?

- Mark as New
- Bookmark
- Subscribe
- Mute
- Subscribe to RSS Feed
- Get Direct Link
- Report Inappropriate Content
How to create a calculated column similar to pivot table in Excel?
I want to use graph builder to slice and dice attrition data. In Excel I would use what is called a calculated field within a pivot table.
My data would look like the attached, where I can select any field as row(s)s or column(s) and the attrition rate would update dynamically since its a caculated field.
How do I do this in JMP? I tried HC/TER and sum(HC)/sum(TER). I did this in the data detail as as a separate column. Neither worked since they only caculate once at the individual level. I need something that will
perform the caculation on update.
Accepted Solutions


- Mark as New
- Bookmark
- Subscribe
- Mute
- Subscribe to RSS Feed
- Get Direct Link
- Report Inappropriate Content
Re: How to create a calculated column similar to pivot table in Excel?
I don't think JMP can do exactly that, with an arbitrary formula evaluated over the dynamic grouping.
If you know the grouping and can create a formula, be sure to use the Col functions and provide the grouping column(s) as BY variable(s): Col Sum( :HC, :KeyEE ) / Col Sum( :TER, :KeyEE )
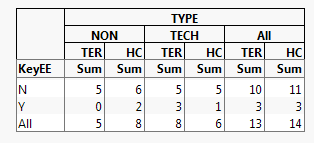
Otherwise you can compare sums (inferring the ratio) with a table in Tabulate:
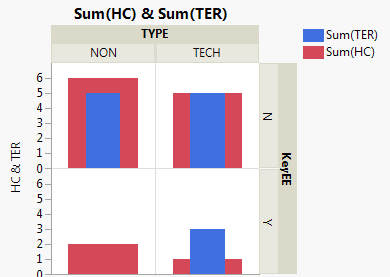
Or graphically in Graph Builder:
- Mark as New
- Bookmark
- Subscribe
- Mute
- Subscribe to RSS Feed
- Get Direct Link
- Report Inappropriate Content
Re: How to create a calculated column similar to pivot table in Excel?
I don't think JMP can do exactly that, with an arbitrary formula evaluated over the dynamic grouping.
If you know the grouping and can create a formula, be sure to use the Col functions and provide the grouping column(s) as BY variable(s): Col Sum( :HC, :KeyEE ) / Col Sum( :TER, :KeyEE )
Otherwise you can compare sums (inferring the ratio) with a table in Tabulate:
Or graphically in Graph Builder:
Recommended Articles
- © 2026 JMP Statistical Discovery LLC. All Rights Reserved.
- Terms of Use
- Privacy Statement
- Contact Us