- Don’t miss your chance to experience Discovery Summit Europe at our best available rate! Early bird registration through 31 Oct.
- Graph Builder Toolbar streamlines interactive graphing. Creates shortcuts on Report and GraphBuilder Helpers toolbars. Download and install the extension.
- Subscribe to RSS Feed
- Mark Topic as New
- Mark Topic as Read
- Float this Topic for Current User
- Bookmark
- Subscribe
- Mute
- Printer Friendly Page
Discussions
Solve problems, and share tips and tricks with other JMP users.- User Community
- :
- Discussions
- :
- Re: How to create Layers in Graph Builder

- Mark as New
- Bookmark
- Subscribe
- Mute
- Subscribe to RSS Feed
- Get Direct Link
- Report Inappropriate Content
How to create Layers in Graph Builder
Hey,
I have three sets of x and y (x1,x2,x3,y1,y2,y3) Data and would like to combine them into one Graph. When I tried using Graph Builder, I could generate a graph for x1, y1,y2,y3. But then the Data is not displayed correctly, hence each pair of data must be combined with its x value.
In origin I can use Layers to combine these three sets of data, is there a way to do it in JMP as well?
Thx
-Winston Churchill
Accepted Solutions


- Mark as New
- Bookmark
- Subscribe
- Mute
- Subscribe to RSS Feed
- Get Direct Link
- Report Inappropriate Content
Re: How to create Layers in Graph Builder
I do not know the structure of your data. Assuming it looks like
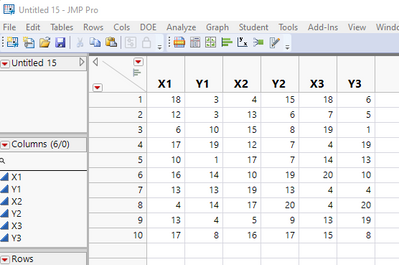
You can stack the data and create a table that looks like
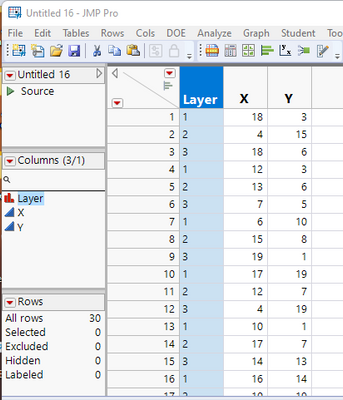
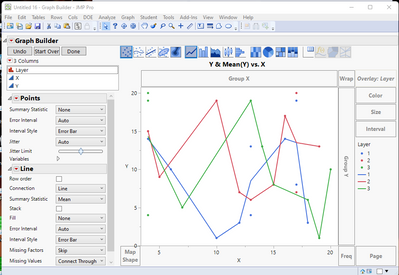
From there you can easily create a multiple X Y chart with 3 layers(Overlays)
- Mark as New
- Bookmark
- Subscribe
- Mute
- Subscribe to RSS Feed
- Get Direct Link
- Report Inappropriate Content
Re: How to create Layers in Graph Builder
I do not know the structure of your data. Assuming it looks like
You can stack the data and create a table that looks like
From there you can easily create a multiple X Y chart with 3 layers(Overlays)

- Mark as New
- Bookmark
- Subscribe
- Mute
- Subscribe to RSS Feed
- Get Direct Link
- Report Inappropriate Content
Re: How to create Layers in Graph Builder
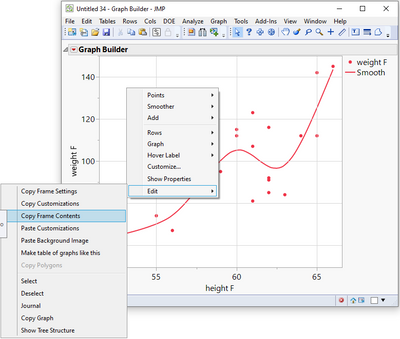
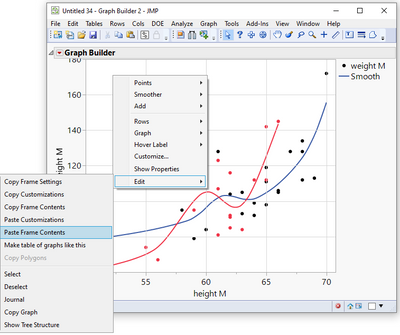
If you just want to take a quick look at the two curves in a combined plot - and don't want to change your table structure for it, you can copy/paste the frame content:
Using JSL to copy the frame contents of one graph to a different graph?
It even works if the data comes from different data tables.
The huge disadvantage of this approach:
When you save the plot or the plot script, it will just save the original plot without the pasted content:
copied frame content disappears when reopening graph or JMP datatable
Recommended Articles
- © 2026 JMP Statistical Discovery LLC. All Rights Reserved.
- Terms of Use
- Privacy Statement
- Contact Us