- JMP Statement Regarding Critical PHP Remote Code Execution Vulnerabilities (CVE-2026-109618, CVE-2026-109619)
- Don’t miss your chance to experience Discovery Summit Europe at our best available rate! Early bird registration through 31 Oct.
- Graph Builder Toolbar streamlines interactive graphing. Creates shortcuts on Report and GraphBuilder Helpers toolbars. Download and install the extension.
- Subscribe to RSS Feed
- Mark Topic as New
- Mark Topic as Read
- Float this Topic for Current User
- Bookmark
- Subscribe
- Mute
- Printer Friendly Page
Discussions
Solve problems, and share tips and tricks with other JMP users.- User Community
- :
- Discussions
- :
- Re: How to change value label colours in Graph Builder

- Mark as New
- Bookmark
- Subscribe
- Mute
- Subscribe to RSS Feed
- Get Direct Link
- Report Inappropriate Content
How to change value label colours in Graph Builder
I have created a chart with stacked bars, showing value labels on each segment of the stack. The default font colour is black (it seems). I want to make them white on this one graph. I have spent way to much time ineffectually poking around in preferences and other likely places but cannot find out how to make this simple change. I know it will be obvious and I will hang my head in shame but I need the help of some kind soul.
- Tags:
- Mass Customization

- Mark as New
- Bookmark
- Subscribe
- Mute
- Subscribe to RSS Feed
- Get Direct Link
- Report Inappropriate Content
Re: How to change value label colours in Graph Builder
Could you share a picture?
- Mark as New
- Bookmark
- Subscribe
- Mute
- Subscribe to RSS Feed
- Get Direct Link
- Report Inappropriate Content
Re: How to change value label colours in Graph Builder
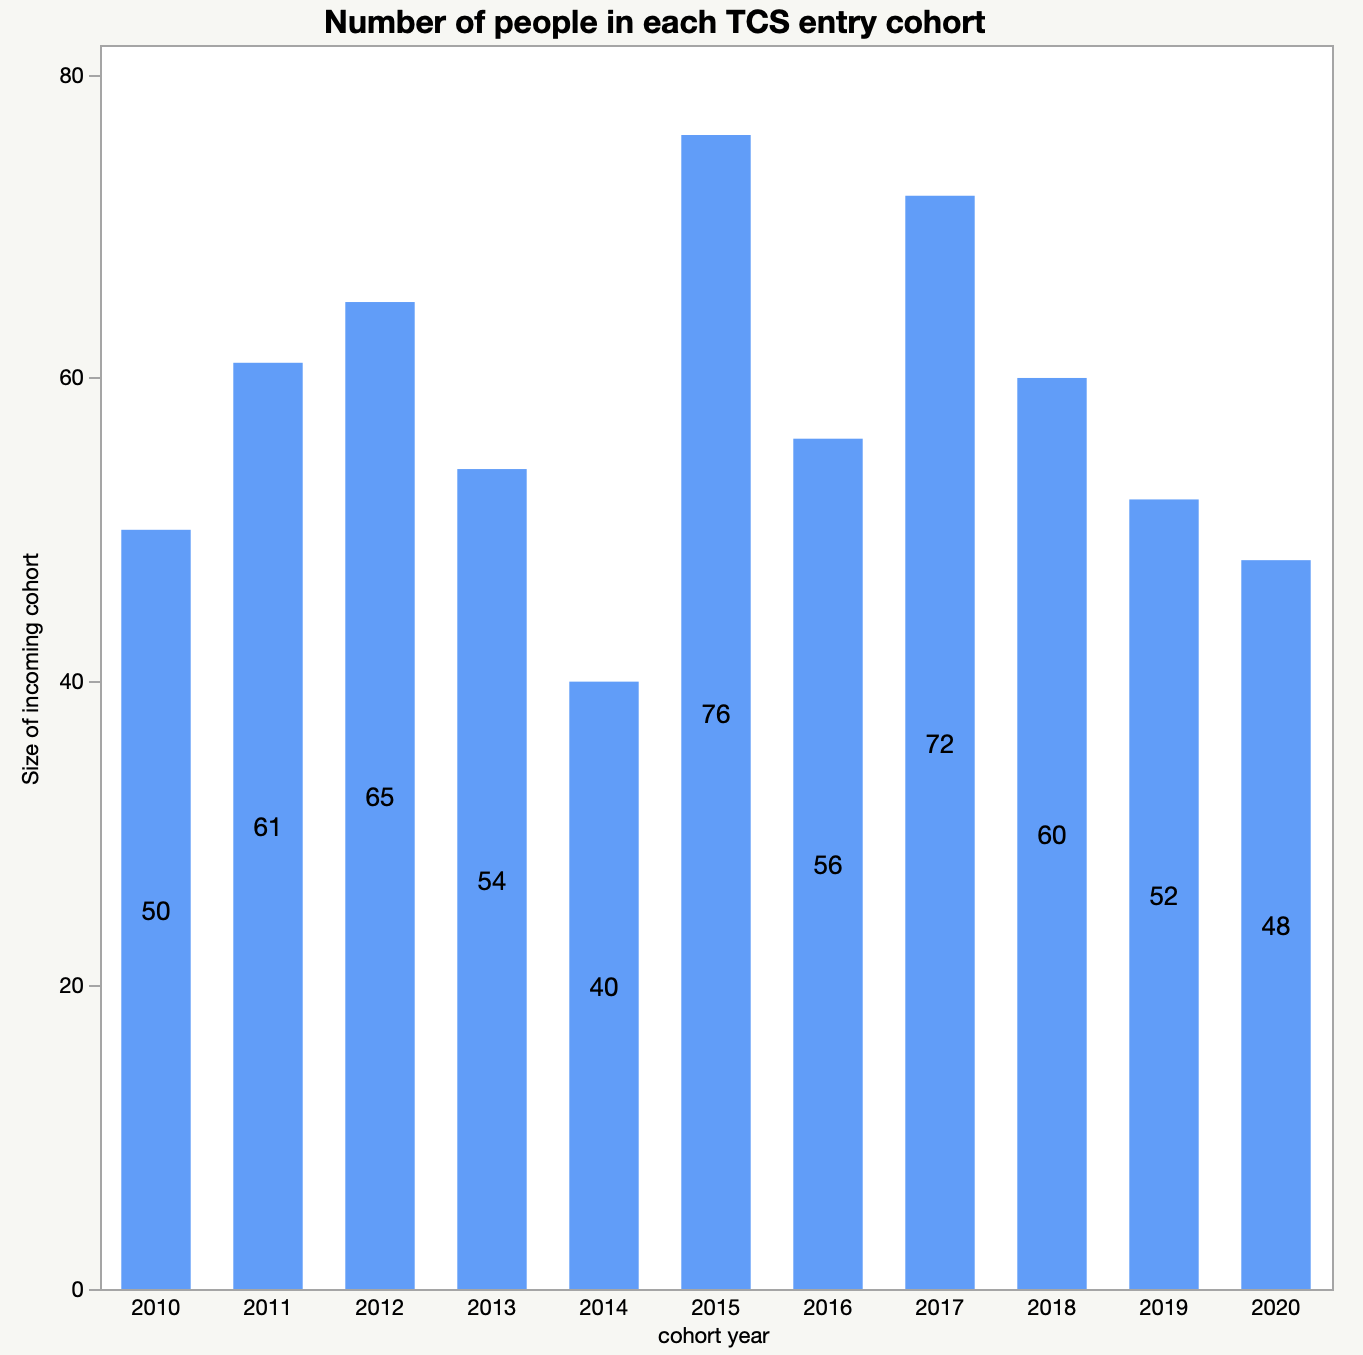
Sure. Here is an example with black type for the number labels.
- Mark as New
- Bookmark
- Subscribe
- Mute
- Subscribe to RSS Feed
- Get Direct Link
- Report Inappropriate Content
Re: How to change value label colours in Graph Builder
I'd suggest you go to file > preferences > platform > graph builder. Then adjust your settings. Tick the boxes you're interested to change. You may reset them back to default if there's anything abnormal. Feel free to let me know how it went

- Mark as New
- Bookmark
- Subscribe
- Mute
- Subscribe to RSS Feed
- Get Direct Link
- Report Inappropriate Content
Re: How to change value label colours in Graph Builder
Right click on the bar, select customize, select bar and in the properties options, the text color should do the trick


- Mark as New
- Bookmark
- Subscribe
- Mute
- Subscribe to RSS Feed
- Get Direct Link
- Report Inappropriate Content
Re: How to change value label colours in Graph Builder
wow, 4 years to solve it : )
Recommended Articles
- © 2026 JMP Statistical Discovery LLC. All Rights Reserved.
- Terms of Use
- Privacy Statement
- Contact Us