Turn on suggestions
Auto-suggest helps you quickly narrow down your search results by suggesting possible matches as you type.
- Image to Table JMP extension imports single or batch images as data tables. Useful to extract curves from pictures or convert image data to curve data to use in analyses like Functional Data Explorer. Download and install the extension.
Options
- Subscribe to RSS Feed
- Mark Topic as New
- Mark Topic as Read
- Float this Topic for Current User
- Bookmark
- Subscribe
- Mute
- Printer Friendly Page
Discussions
Solve problems, and share tips and tricks with other JMP users.- User Community
- :
- Discussions
- :
- Graph builder - Summary Statistics for multiple X values

Level XIII
- Mark as New
- Bookmark
- Subscribe
- Mute
- Subscribe to RSS Feed
- Get Direct Link
- Report Inappropriate Content
Graph builder - Summary Statistics for multiple X values
Nov 7, 2024 06:55 AM
(1800 views)
Hi,
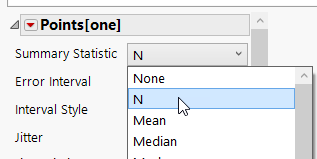
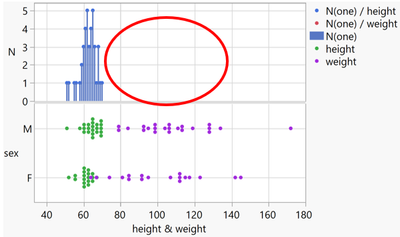
Seems that Summary Statistics in Graph builder are just available for one value on the X axis?!
is there a trick to get the red data points for 
Names Default to Here(1);
dt = Open( "$SAMPLE_DATA/Big Class.jmp" );
New Column( "one",
	Formula( 1 )
);

Graph Builder(
	Graph Spacing( 4 ),
	Variables(
		X( :height ),
		X( :weight, Position( 1 ) ),
		Y( :one ),
		Y( :sex )
	),
	Elements(
		Position( 1, 1 ),
		Points( X( 1 ), X( 2 ), Y,  Summary Statistic( "N" ) ),
		Bar( X( 1 ), X( 2 ), Y,  Bar Style( "Stacked" ), Summary Statistic( "N" ) )
	),
	Elements( Position( 1, 2 ), Points( X( 1 ), X( 2 ), Y ) )
);
1 ACCEPTED SOLUTION
Accepted Solutions
Level XIII
Solution
- Mark as New
- Bookmark
- Subscribe
- Mute
- Subscribe to RSS Feed
- Get Direct Link
- Report Inappropriate Content
Re: Graph builder - Summary Statistics for multiple X values
Created:
Nov 7, 2024 07:07 AM
| Last Modified: Nov 7, 2024 4:21 AM
(1797 views)
| Posted in reply to message from hogi 11-07-2024
Ah, one can add an additional element, selectively for the second column on the X axis:

Names Default to Here(1);
dt = Open( "$SAMPLE_DATA/Big Class.jmp" );
New Column( "one",
	Formula( 1 )
);

Graph Builder(
	Variables(
		X( :height ),
		X( :weight, Position( 1 ) ),
		Y( :one ),
		Y( :sex )
	),
	Elements(
		Position( 1, 1 ),
		Points( X( 1 ), Y,  Summary Statistic( "N" ) ),
		Points( X( 2 ), Y,  Summary Statistic( "N" ) )
	),
	Elements( Position( 1, 2 ), Points( X( 1 ), X( 2 ), Y ) )
);
2 REPLIES 2
Level XIII
Solution
- Mark as New
- Bookmark
- Subscribe
- Mute
- Subscribe to RSS Feed
- Get Direct Link
- Report Inappropriate Content
Re: Graph builder - Summary Statistics for multiple X values
Created:
Nov 7, 2024 07:07 AM
| Last Modified: Nov 7, 2024 4:21 AM
(1797 views)
| Posted in reply to message from hogi 11-07-2024
Ah, one can add an additional element, selectively for the second column on the X axis:
Names Default to Here(1);
dt = Open( "$SAMPLE_DATA/Big Class.jmp" );
New Column( "one",
	Formula( 1 )
);

Graph Builder(
	Variables(
		X( :height ),
		X( :weight, Position( 1 ) ),
		Y( :one ),
		Y( :sex )
	),
	Elements(
		Position( 1, 1 ),
		Points( X( 1 ), Y,  Summary Statistic( "N" ) ),
		Points( X( 2 ), Y,  Summary Statistic( "N" ) )
	),
	Elements( Position( 1, 2 ), Points( X( 1 ), X( 2 ), Y ) )
);
Level XIII
- Mark as New
- Bookmark
- Subscribe
- Mute
- Subscribe to RSS Feed
- Get Direct Link
- Report Inappropriate Content
Re: Graph builder - Summary Statistics for multiple X values
... but strange why it's necessary !?
Recommended Articles
- © 2026 JMP Statistical Discovery LLC. All Rights Reserved.
- Terms of Use
- Privacy Statement
- Contact Us