- Subscribe to RSS Feed
- Mark Topic as New
- Mark Topic as Read
- Float this Topic for Current User
- Bookmark
- Subscribe
- Mute
- Printer Friendly Page
Discussions
Solve problems, and share tips and tricks with other JMP users.- JMP User Community
- :
- Discussions
- :
- How to add equation and Rsq to linear regression graph?
- Mark as New
- Bookmark
- Subscribe
- Mute
- Subscribe to RSS Feed
- Get Direct Link
- Report Inappropriate Content
How to add equation and Rsq to linear regression graph?
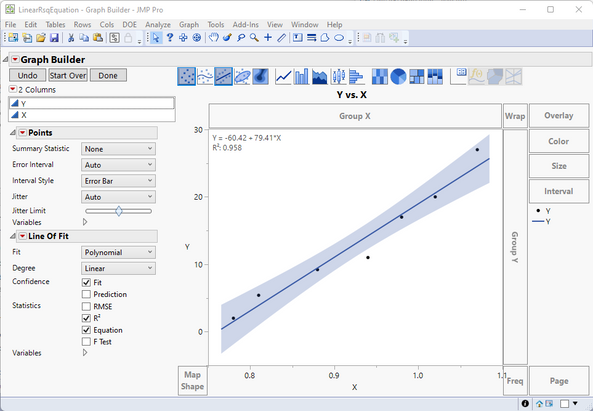
I did a linear regression and get the linear graph, equation and R squared. But the graph only shows the linear line and data point. Does anybody know how to add the equation and R squared value on the graph, like excel normally will do?
Thank you a lot!
Accepted Solutions
- Mark as New
- Bookmark
- Subscribe
- Mute
- Subscribe to RSS Feed
- Get Direct Link
- Report Inappropriate Content
Re: How to add equation and Rsq to linear regression graph?
This capability is handled in the Graph Builder
Drag the x and y columns to their drop areas, then select the line of fit icon to add the regression line to the chart, then right click on the chart and under the Line of Fit object, add the Rsquare and Equation
Recommended Articles
- © 2026 JMP Statistical Discovery LLC. All Rights Reserved.
- Terms of Use
- Privacy Statement
- Contact Us


