- New to JMP? Let the Data Analysis Director guide you through selecting an analysis task, an analysis goal, and a data type. Available now in the JMP Marketplace!
- See how to install JMP Marketplace extensions to customize and enhance JMP.
- Subscribe to RSS Feed
- Mark Topic as New
- Mark Topic as Read
- Float this Topic for Current User
- Bookmark
- Subscribe
- Mute
- Printer Friendly Page
Discussions
Solve problems, and share tips and tricks with other JMP users.- JMP User Community
- :
- Discussions
- :
- Combining the Chart
- Mark as New
- Bookmark
- Subscribe
- Mute
- Subscribe to RSS Feed
- Get Direct Link
- Report Inappropriate Content
Combining the Chart
Hi,
I have 3 separate variability chart, and now i want to combine all the 3 variability chart together in one interface.
Is it possible the JSL can do this?
Thanks
Accepted Solutions
- Mark as New
- Bookmark
- Subscribe
- Mute
- Subscribe to RSS Feed
- Get Direct Link
- Report Inappropriate Content
Re: Combining the Chart
Here is a simple script that puts together 3 different variability charts. You need to read the scripting guide to get a well rounded education on how powerful JSL is:
Help==>Books==>Scripting Guide
Names Default To Here( 1 );
dt = Open( "$SAMPLE_DATA\semiconductor capability.jmp" );

New Window( "Variability Charts",
	H List Box(
		Variability Chart(
			Y( :NPN1 ),
			X( :SITE ),
			Max Iter( 100 ),
			Conv Limit( 0.00000001 ),
			Number Integration Abscissas( 128 ),
			Number Function Evals( 65536 ),
			Analysis Type( "Choose best analysis (EMS REML Bayesian)" ),
			Std Dev Chart( 1 )
		),
		Variability Chart(
			Y( :NPN1 ),
			X( :Lot_id ),
			Max Iter( 100 ),
			Conv Limit( 0.00000001 ),
			Number Integration Abscissas( 128 ),
			Number Function Evals( 65536 ),
			Analysis Type( "Choose best analysis (EMS REML Bayesian)" ),
			Std Dev Chart( 1 )
		),
		Variability Chart(
			Y( :NPN1 ),
			X( :wafer ),
			Max Iter( 100 ),
			Conv Limit( 0.00000001 ),
			Number Integration Abscissas( 128 ),
			Number Function Evals( 65536 ),
			Analysis Type( "Choose best analysis (EMS REML Bayesian)" ),
			Std Dev Chart( 1 )
		)
	)
);
- Mark as New
- Bookmark
- Subscribe
- Mute
- Subscribe to RSS Feed
- Get Direct Link
- Report Inappropriate Content
Re: Combining the Chart
Jim's answer is correct, of course, for you specific question. But did you know that you do not need a script to achieve this result?
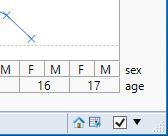
With the three Variability Chart platforms open, click the check box in the lower right corner of each platform. They should look like this:
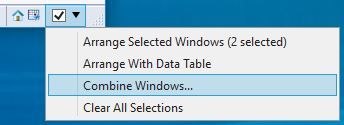
Now click the black triangle in the same corner and select Combine Windows.
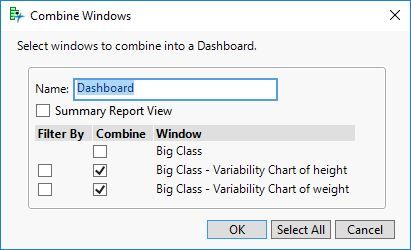
You are given some more choices:
You are done when you click OK if this dashboard is a one-time thing but if you want to re-use it in the future, click the top left red triangle next to Report:
This feature is fully described in Help > Books > Using JMP.
- Mark as New
- Bookmark
- Subscribe
- Mute
- Subscribe to RSS Feed
- Get Direct Link
- Report Inappropriate Content
Re: Combining the Chart
You could also use File > New > New Dashboard. This has a drag and drop interface with results similar to what @Mark_Bailey shows. It also writes all the JSL for you so you can just use the Save Script > to Data Table under the Dashboard's Red Triangle Menu to get the code built into the data table.
Best,
M
- Mark as New
- Bookmark
- Subscribe
- Mute
- Subscribe to RSS Feed
- Get Direct Link
- Report Inappropriate Content
Re: Combining the Chart
And to pile onto my colleagues' @MikeD_Anderson and @Mark_Bailey remarks taking it one step further from either the Dashboard path or Combined Windows view, once your window if final, you can, from the JMP main menu bar select File -> Save As -> Save as Type: Interactive HTML with Data and you'll create an HTML object that anybody with a browser can open, view and have limited interactivity which is JMP's hallmark.
- Mark as New
- Bookmark
- Subscribe
- Mute
- Subscribe to RSS Feed
- Get Direct Link
- Report Inappropriate Content
Re: Combining the Chart
Here is a simple script that puts together 3 different variability charts. You need to read the scripting guide to get a well rounded education on how powerful JSL is:
Help==>Books==>Scripting Guide
Names Default To Here( 1 );
dt = Open( "$SAMPLE_DATA\semiconductor capability.jmp" );

New Window( "Variability Charts",
	H List Box(
		Variability Chart(
			Y( :NPN1 ),
			X( :SITE ),
			Max Iter( 100 ),
			Conv Limit( 0.00000001 ),
			Number Integration Abscissas( 128 ),
			Number Function Evals( 65536 ),
			Analysis Type( "Choose best analysis (EMS REML Bayesian)" ),
			Std Dev Chart( 1 )
		),
		Variability Chart(
			Y( :NPN1 ),
			X( :Lot_id ),
			Max Iter( 100 ),
			Conv Limit( 0.00000001 ),
			Number Integration Abscissas( 128 ),
			Number Function Evals( 65536 ),
			Analysis Type( "Choose best analysis (EMS REML Bayesian)" ),
			Std Dev Chart( 1 )
		),
		Variability Chart(
			Y( :NPN1 ),
			X( :wafer ),
			Max Iter( 100 ),
			Conv Limit( 0.00000001 ),
			Number Integration Abscissas( 128 ),
			Number Function Evals( 65536 ),
			Analysis Type( "Choose best analysis (EMS REML Bayesian)" ),
			Std Dev Chart( 1 )
		)
	)
);
- Mark as New
- Bookmark
- Subscribe
- Mute
- Subscribe to RSS Feed
- Get Direct Link
- Report Inappropriate Content
Re: Combining the Chart
Dear Jim,
I tried this proposal to combine the charts. It works.
Now, I'd like to have the results in one table.
I did it with "right click" and "Make Combined Data Table".
It still works. But I'd like to have this piece of code in my script.
JMP doesn't generate a script/code in a new table.
Can you give me an advice how to address the boxes correctly?
This was a working solution before I combined the charts:
Report( platform[1] )[Outline Box( "Gauge R&R" )][Table Box( 1 )] << Make Combined Data Table;- Mark as New
- Bookmark
- Subscribe
- Mute
- Subscribe to RSS Feed
- Get Direct Link
- Report Inappropriate Content
Re: Combining the Chart
Here is an example that creates the combined output table you want
Names Default To Here( 1 );
dt = Open( "$SAMPLE_DATA\semiconductor capability.jmp" );

New Window( "Variability Charts",
	H List Box(
		vc = Variability Chart(
			Y( :NPN1 ),
			X( :SITE ),
			Model( "Main Effect" ),
			Historical Sigma( 0 ),
			"Gauge R&R"n( 6, 27.48 ),
			"Gauge R&R Report"n( 1 )
		),
		Variability Chart(
			Y( :NPN1 ),
			X( :lot_id ),
			Model( "Main Effect" ),
			Historical Sigma( 0 ),
			"Gauge R&R"n( 6, 27.48 ),
			"Gauge R&R Report"n( 1 )
		),
		Variability Chart(
			Y( :NPN1 ),
			X( :wafer ),
			Model( "Main Effect" ),
			Historical Sigma( 0 ),
			"Gauge R&R"n( 6, 27.48 ),
			"Gauge R&R Report"n( 1 )
		)
	)
);
report(vc)["Gauge R&R"][TableBox(1)]<<make combined data table;- Mark as New
- Bookmark
- Subscribe
- Mute
- Subscribe to RSS Feed
- Get Direct Link
- Report Inappropriate Content
Re: Combining the Chart
Jim's answer is correct, of course, for you specific question. But did you know that you do not need a script to achieve this result?
With the three Variability Chart platforms open, click the check box in the lower right corner of each platform. They should look like this:
Now click the black triangle in the same corner and select Combine Windows.
You are given some more choices:
You are done when you click OK if this dashboard is a one-time thing but if you want to re-use it in the future, click the top left red triangle next to Report:
This feature is fully described in Help > Books > Using JMP.
- Mark as New
- Bookmark
- Subscribe
- Mute
- Subscribe to RSS Feed
- Get Direct Link
- Report Inappropriate Content
Re: Combining the Chart
You could also use File > New > New Dashboard. This has a drag and drop interface with results similar to what @Mark_Bailey shows. It also writes all the JSL for you so you can just use the Save Script > to Data Table under the Dashboard's Red Triangle Menu to get the code built into the data table.
Best,
M
- Mark as New
- Bookmark
- Subscribe
- Mute
- Subscribe to RSS Feed
- Get Direct Link
- Report Inappropriate Content
Re: Combining the Chart
And to pile onto my colleagues' @MikeD_Anderson and @Mark_Bailey remarks taking it one step further from either the Dashboard path or Combined Windows view, once your window if final, you can, from the JMP main menu bar select File -> Save As -> Save as Type: Interactive HTML with Data and you'll create an HTML object that anybody with a browser can open, view and have limited interactivity which is JMP's hallmark.
Recommended Articles
- © 2026 JMP Statistical Discovery LLC. All Rights Reserved.
- Terms of Use
- Privacy Statement
- Contact Us


