- Learn how to build custom Python data connectors and further customize JMP’s Data Connector Framework with the Python Data Connector Demo, available now in the JMP Marketplace!
- See how to use Accelerated Life Testing (ALT) to evaluate reliability. Register for June 5 webinar, 2pm US Eastern Time.
- Subscribe to RSS Feed
- Mark Topic as New
- Mark Topic as Read
- Float this Topic for Current User
- Bookmark
- Subscribe
- Mute
- Printer Friendly Page
Discussions
Solve problems, and share tips and tricks with other JMP users.- JMP User Community
- :
- Discussions
- :
- Re: How to access/change box plot colors in script

- Mark as New
- Bookmark
- Subscribe
- Mute
- Subscribe to RSS Feed
- Get Direct Link
- Report Inappropriate Content
How to access/change box plot colors in script
Hello,
I am wrinting scripts to automatically collect data and make graphs...
My issue is that I get a graph with varying number of box plots (26 boxes in the example attached), I would like to change the box plot properties (Fillcolor, line color, transparency,...) but I do not know how to access the 26 box plots at a time or seperatly (but via a script)...
I checked manually and I see that there are several boxplot objects: I even modified manually the color of Box Plot (50), but when I look at the script and try to modifyu it, it does not work...
So my question: How to ask and get the references to all the boxplots ?
And how to change their properties (all of them) ?
Many thanks.
PS: for ease, I included a graph and the original table I used (the script is embedded in the data table). The script I get is also added.

Graph Builder(
	Show Legend( 0 ),
	Y Group Title Orientation( "Horizontal" ),
	Y Group Level Orientation( "Horizontal" ),
	Variables( X( :QVoltages ), Y( :Value ) ),
	Elements(
		Points( X, Y, Legend( 1 ), Jitter( 1 ) ),
		Box Plot(
			X,
			Y,
			Legend( 3 ),
			Jitter( 1 ),
			Outliers( 1 ),
			Box Style( "Outlier" )
		)
	),
	SendToReport(
		Dispatch(
			{},
			"QVoltages",
			ScaleBox,
			{Show Major Grid( 1 ), Show Minor Grid( 1 ), Inside Ticks( 1 ),
			Rotated Labels( "Vertical" )}
		),
		Dispatch(
			{},
			"Ron_1p5V [Ohm]",
			ScaleBox,
			{Min( 40 ), Max( 100 ), Inc( 10 ), Minor Ticks( 1 ),
			Show Major Grid( 1 ), Show Minor Grid( 1 ), Inside Ticks( 1 )}
		),
		Dispatch( {}, "graph title", TextEditBox, {Set Text( "" )} ),
		Dispatch( {}, "Y title", TextEditBox, {Set Text( "Value" )} ),
		Dispatch(
			{},
			"Graph Builder",
			FrameBox,
			{DispatchSeg(
				Box Plot Seg( "Box Plot (50)" ),
				{Box Style( "Outlier" ), Line Color( "Dark Red" ), Line Width( 2 ),
				Fill Color( "Red" ), Transparency( 0.5 )}
			)}
		)
	)
)Accepted Solutions

- Mark as New
- Bookmark
- Subscribe
- Mute
- Subscribe to RSS Feed
- Get Direct Link
- Report Inappropriate Content
Re: How to access/change box plot colors in script
Using your table, you can do this kind of thing:
gb = Graph Builder(
	Show Legend( 0 ),
	Y Group Title Orientation( "Horizontal" ),
	Y Group Level Orientation( "Horizontal" ),
	Variables( X( :QVoltages ), Y( :Value ) ),
	Elements(
		Points( X, Y, Legend( 1 ), Jitter( 1 ) ),
		Box Plot( X, Y, Legend( 3 ), Jitter( 1 ), Outliers( 1 ), Box Style( "Outlier" ) )
	),
	SendToReport(
		Dispatch(
			{},
			"QVoltages",
			ScaleBox,
			{Show Major Grid( 1 ), Show Minor Grid( 1 ), Inside Ticks( 1 ), Rotated Labels( "Vertical" )}
		),
		Dispatch(
			{},
			"Value",
			ScaleBox,
			{Min( 40 ), Max( 100 ), Inc( 10 ), Minor Ticks( 1 ), Show Major Grid( 1 ), Show Minor Grid( 1 ),
			Inside Ticks( 1 )}
		),
		Dispatch( {}, "graph title", TextEditBox, {Set Text( "" )} ),
		Dispatch( {}, "Y title", TextEditBox, {Set Text( "Value" )} )
	)
);
gbRep = Report( gb );
nbp = gbRep[FrameBox( 1 )] << segCount("Box Plot Seg");
for(n=1, n<=nbp, n++,
	s = gbRep[FrameBox( 1 )] << FindSeg( Box Plot Seg(n) );
	s << Fill Color( "Green" );
);
// Uncomment the line beloe to see what other messages a 'BoxPlotSeg()' understands
// Show Properties( s );- Mark as New
- Bookmark
- Subscribe
- Mute
- Subscribe to RSS Feed
- Get Direct Link
- Report Inappropriate Content
Re: How to access/change box plot colors in script
Once you have the type of display box you are interested in (for example, a 'text edit box ()'), you can search for that in the scripting index (see Jim's post above). Then you will see what messages are relevant and (usually) an example.


- Mark as New
- Bookmark
- Subscribe
- Mute
- Subscribe to RSS Feed
- Get Direct Link
- Report Inappropriate Content
Re: How to access/change box plot colors in script
The elements are referenced by either their absolute position from the entry into the report structure, or by a relative reference from a fixed, unique point within the report structure.
["Graph Builder"][TextEditBox(1)]<<set text("new title");
This example points to the Graph Builder outline box and then references the first text edit box under the outline box.
The simplicity of the Graph Builder output only has the one outline box, but in other cases there are multiple outline boxes that a reference to a particular on would take the reference off on a different path.
;
- Mark as New
- Bookmark
- Subscribe
- Mute
- Subscribe to RSS Feed
- Get Direct Link
- Report Inappropriate Content
Re: How to access/change box plot colors in script
- Mark as New
- Bookmark
- Subscribe
- Mute
- Subscribe to RSS Feed
- Get Direct Link
- Report Inappropriate Content
Re: How to access/change box plot colors in script
Using your table, you can do this kind of thing:
gb = Graph Builder(
	Show Legend( 0 ),
	Y Group Title Orientation( "Horizontal" ),
	Y Group Level Orientation( "Horizontal" ),
	Variables( X( :QVoltages ), Y( :Value ) ),
	Elements(
		Points( X, Y, Legend( 1 ), Jitter( 1 ) ),
		Box Plot( X, Y, Legend( 3 ), Jitter( 1 ), Outliers( 1 ), Box Style( "Outlier" ) )
	),
	SendToReport(
		Dispatch(
			{},
			"QVoltages",
			ScaleBox,
			{Show Major Grid( 1 ), Show Minor Grid( 1 ), Inside Ticks( 1 ), Rotated Labels( "Vertical" )}
		),
		Dispatch(
			{},
			"Value",
			ScaleBox,
			{Min( 40 ), Max( 100 ), Inc( 10 ), Minor Ticks( 1 ), Show Major Grid( 1 ), Show Minor Grid( 1 ),
			Inside Ticks( 1 )}
		),
		Dispatch( {}, "graph title", TextEditBox, {Set Text( "" )} ),
		Dispatch( {}, "Y title", TextEditBox, {Set Text( "Value" )} )
	)
);
gbRep = Report( gb );
nbp = gbRep[FrameBox( 1 )] << segCount("Box Plot Seg");
for(n=1, n<=nbp, n++,
	s = gbRep[FrameBox( 1 )] << FindSeg( Box Plot Seg(n) );
	s << Fill Color( "Green" );
);
// Uncomment the line beloe to see what other messages a 'BoxPlotSeg()' understands
// Show Properties( s );- Mark as New
- Bookmark
- Subscribe
- Mute
- Subscribe to RSS Feed
- Get Direct Link
- Report Inappropriate Content
Re: How to access/change box plot colors in script
Thanks a lot Ian.
Your script does exactly what I wanted !!!!!
May I ask a further explanation ? I see that you introduced: 1/ Report. 2/ FrameBox(1). 3/ SegCount. 4/ FindSeg...
That means you know about those objects or properties...
The question is: in my case, if I have to figure out how a graph is organized, where should I look ? is there a documentation that explicitely explains it ? (in matlab for example, they use for each object handlers, references and parents/childs oblects...so it is easy to scroll through the tree and find you way...).
Again, Many thanks !!!!!
- Mark as New
- Bookmark
- Subscribe
- Mute
- Subscribe to RSS Feed
- Get Direct Link
- Report Inappropriate Content
Re: How to access/change box plot colors in script
Help==>Books==>Scripting Guide
and
Help==>Scripting Index
- Mark as New
- Bookmark
- Subscribe
- Mute
- Subscribe to RSS Feed
- Get Direct Link
- Report Inappropriate Content
Re: How to access/change box plot colors in script
Yes, it's al in the doc Jim references.
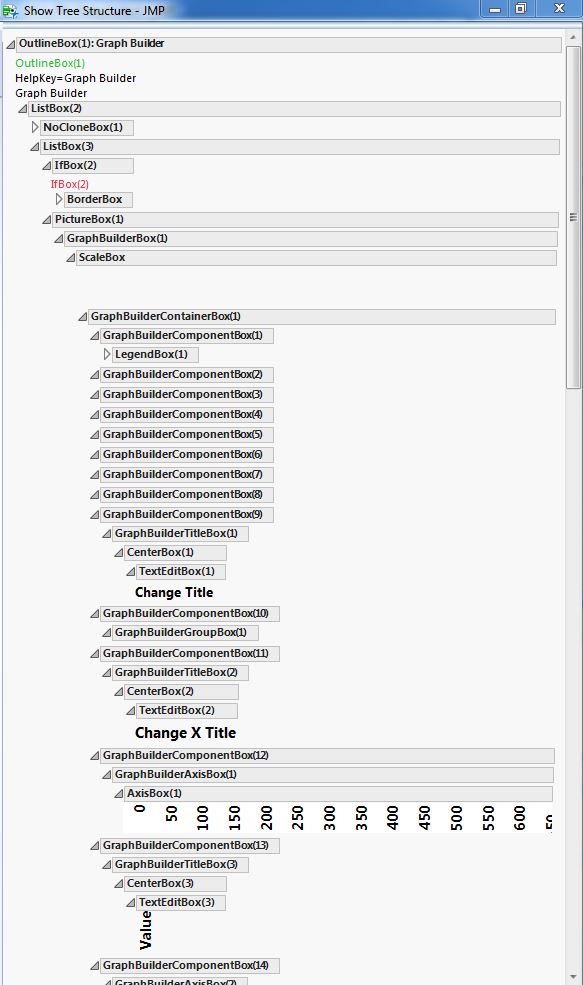
When you launch a JMP platofrm, it's helpful to think of the resulting window of consisting of two layers: The 'analysis layer' ('red triangle' options) and the 'report layer' (the hierarchical structure of display boxes that compose the contents of the window). If you right click on the little disclosure triangle of the topmost outline box (in this case, with the title 'Graph Builder'), you should see an 'Edit > Show Tree Structure' option which shows which display boxes are involved.
- Mark as New
- Bookmark
- Subscribe
- Mute
- Subscribe to RSS Feed
- Get Direct Link
- Report Inappropriate Content
Re: How to access/change box plot colors in script
Thanks ian,
I think with your explanation I can find my way in simple graphs.
I went through the documentation and I must say it is a lot of info and not alwats easy to find my way...but I keep practicing.
For example, in the example I attached, suppose I want to change something, let's say the title of the graph and the title of the X and Y axes. I know you will say: change that via the regular way...but suppose I want to access them via the tree structure (look at the picture attached).
I see :
"Change title" under TextEditBox(1)
"Change X title" under TextEditBox(2)
"Value" under TextEditBox(3)
How can I get those strings and modify them via the tree ?
Thanks again !!!!!
- Mark as New
- Bookmark
- Subscribe
- Mute
- Subscribe to RSS Feed
- Get Direct Link
- Report Inappropriate Content
Re: How to access/change box plot colors in script
Once you have the type of display box you are interested in (for example, a 'text edit box ()'), you can search for that in the scripting index (see Jim's post above). Then you will see what messages are relevant and (usually) an example.
- Mark as New
- Bookmark
- Subscribe
- Mute
- Subscribe to RSS Feed
- Get Direct Link
- Report Inappropriate Content
Re: How to access/change box plot colors in script
The elements are referenced by either their absolute position from the entry into the report structure, or by a relative reference from a fixed, unique point within the report structure.
["Graph Builder"][TextEditBox(1)]<<set text("new title");
This example points to the Graph Builder outline box and then references the first text edit box under the outline box.
The simplicity of the Graph Builder output only has the one outline box, but in other cases there are multiple outline boxes that a reference to a particular on would take the reference off on a different path.
;
Recommended Articles
- © 2026 JMP Statistical Discovery LLC. All Rights Reserved.
- Terms of Use
- Privacy Statement
- Contact Us