- JMP Statement Regarding Critical PHP Remote Code Execution Vulnerabilities (CVE-2026-109618, CVE-2026-109619)
- Don’t miss your chance to experience Discovery Summit Europe at our best available rate! Early bird registration through 31 Oct.
- Graph Builder Toolbar streamlines interactive graphing. Creates shortcuts on Report and GraphBuilder Helpers toolbars. Download and install the extension.
- Subscribe to RSS Feed
- Mark Topic as New
- Mark Topic as Read
- Float this Topic for Current User
- Bookmark
- Subscribe
- Mute
- Printer Friendly Page
Discussions
Solve problems, and share tips and tricks with other JMP users.- User Community
- :
- Discussions
- :
- How do I get vertical dots in Graph Builder?

- Mark as New
- Bookmark
- Subscribe
- Mute
- Subscribe to RSS Feed
- Get Direct Link
- Report Inappropriate Content
How do I get vertical dots in Graph Builder?
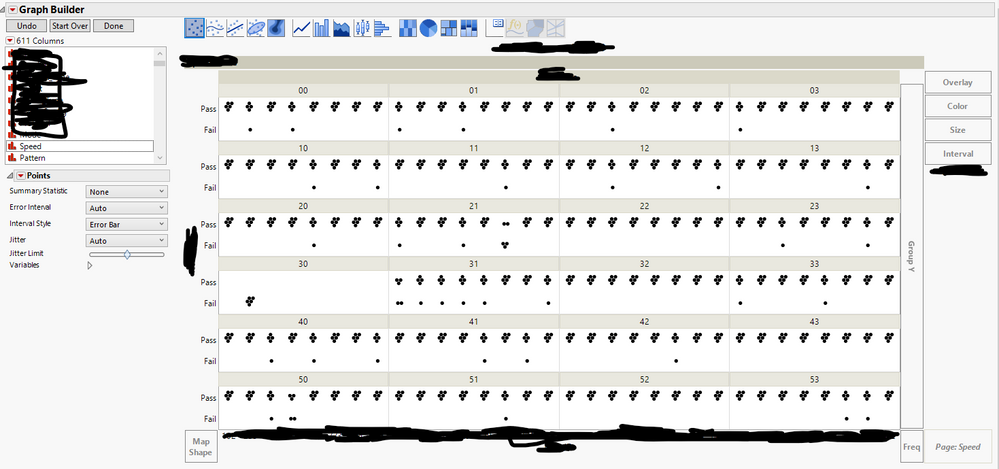
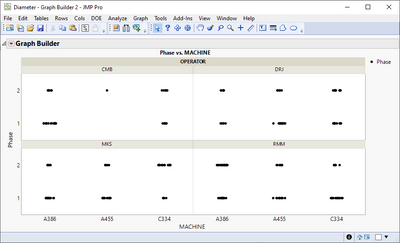
How do I get these dots back into a vertical orientation instead of a "cluster" shown here? The 4-5 dots used to be vertically aligned. Using JMP 16.
Accepted Solutions


- Mark as New
- Bookmark
- Subscribe
- Mute
- Subscribe to RSS Feed
- Get Direct Link
- Report Inappropriate Content
Re: How do I get vertical dots in Graph Builder?
I think changing Jitter settings is only option you have if you want to use Points. Could it be possible to use other visualization such as bar chart?
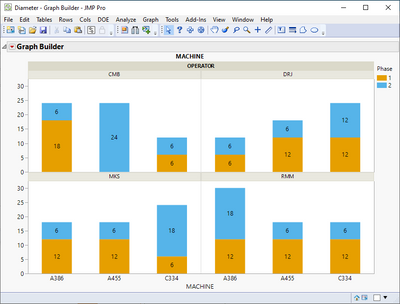
Instead of
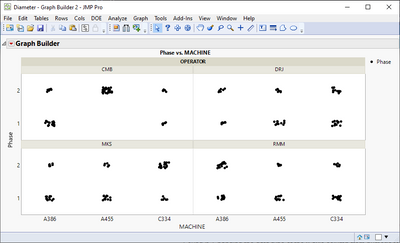
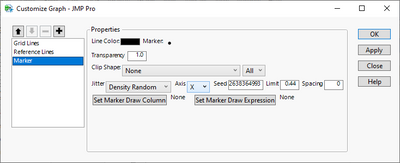
You can use Customize menu to change Marker's Jitter settingsin more detail (especially Axis and Jitter type)
Also going through Essential Graphing from JMP Help page can give some other ideas

- Mark as New
- Bookmark
- Subscribe
- Mute
- Subscribe to RSS Feed
- Get Direct Link
- Report Inappropriate Content
Re: How do I get vertical dots in Graph Builder?
You can try changing the choice of the parameter "Jitter" and the jitter limit to get to your desired result.
See more infos about these parameters here : https://www.jmp.com/support/help/en/17.0/#page/jmp/points.shtml#ww659883
"It is not unusual for a well-designed experiment to analyze itself" (Box, Hunter and Hunter)
- Mark as New
- Bookmark
- Subscribe
- Mute
- Subscribe to RSS Feed
- Get Direct Link
- Report Inappropriate Content
Re: How do I get vertical dots in Graph Builder?
Found it. Changing the data type of the x-axis column from numeric to character causes the arrangement of the points to change from vertical to "cluster" as previously shown.
I accidentally clicked on "accept solution". Don't know how to edit/undo. Victor's reply didn't work.

- Mark as New
- Bookmark
- Subscribe
- Mute
- Subscribe to RSS Feed
- Get Direct Link
- Report Inappropriate Content
Re: How do I get vertical dots in Graph Builder?
Welcome to the community. Sorry for the confusion. I unmarked Victor's answer as the solution. Did you fix it yourself or do you need help changing the data type?
- Mark as New
- Bookmark
- Subscribe
- Mute
- Subscribe to RSS Feed
- Get Direct Link
- Report Inappropriate Content
Re: How do I get vertical dots in Graph Builder?
I think changing Jitter settings is only option you have if you want to use Points. Could it be possible to use other visualization such as bar chart?
Instead of
You can use Customize menu to change Marker's Jitter settingsin more detail (especially Axis and Jitter type)
Also going through Essential Graphing from JMP Help page can give some other ideas
Recommended Articles
- © 2026 JMP Statistical Discovery LLC. All Rights Reserved.
- Terms of Use
- Privacy Statement
- Contact Us