- Don’t miss your chance to experience Discovery Summit Europe at our best available rate! Early bird registration through 31 Oct.
- Graph Builder Toolbar streamlines interactive graphing. Creates shortcuts on Report and GraphBuilder Helpers toolbars. Download and install the extension.
- Subscribe to RSS Feed
- Mark Topic as New
- Mark Topic as Read
- Float this Topic for Current User
- Bookmark
- Subscribe
- Mute
- Printer Friendly Page
Discussions
Solve problems, and share tips and tricks with other JMP users.- User Community
- :
- Discussions
- :
- How to put censor tick marks in survival curve in JMP?

- Mark as New
- Bookmark
- Subscribe
- Mute
- Subscribe to RSS Feed
- Get Direct Link
- Report Inappropriate Content
How to put censor tick marks in survival curve in JMP?
Hi,
I was wondering how I can put censor tick marks on my survival curves generated in JMP? I can't seem to figure it out. Any help would be appreciated.
Thanks
Accepted Solutions


- Mark as New
- Bookmark
- Subscribe
- Mute
- Subscribe to RSS Feed
- Get Direct Link
- Report Inappropriate Content
Re: How to put censor tick marks in survival curve in JMP?
Hello,
There is an addin that does this here: https://community.jmp.com/docs/DOC-7472
The censored values are plotted on the x-axis, rather than on the curve itself.
Cheers,
Brady

- Mark as New
- Bookmark
- Subscribe
- Mute
- Subscribe to RSS Feed
- Get Direct Link
- Report Inappropriate Content
Re: How to put censor tick marks in survival curve in JMP?
Hello,
Plotting censored values in a Life Distribution might have some useful information for you.
Best,
Michael
Principal Statistical Writer
Manager, Statistical Documentation
JMP Development

- Mark as New
- Bookmark
- Subscribe
- Mute
- Subscribe to RSS Feed
- Get Direct Link
- Report Inappropriate Content
Re: How to put censor tick marks in survival curve in JMP?
Something like this?
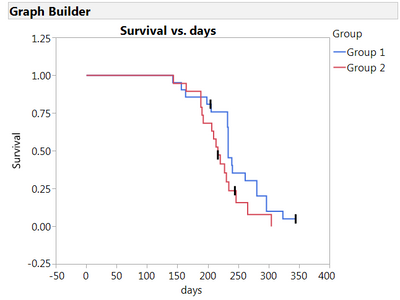
Takes a few steps but it's not too hard. The basic idea is this:
- Run the analysis in the Survival Platform
- Find the table of survival data in the report, right-click, choose "Make into Combined Data Table."
- Fire up the Graph Builder and make the line plot. In JMP 12, you can produce the survival curves using the "Step" option in the line connection selection box.
- Start a separate Graph Builder window and create a scatterplot that shows the censored values only. I used the local data filter for this.
- Right click in the scatterplot window and choose Edit > Copy Frame Contents.
- Right click in the line plot window and choose Edit > Paste Frame Contents.
Message me if you want a more complete walkthrough.
Cheers,
Jordan

- Mark as New
- Bookmark
- Subscribe
- Mute
- Subscribe to RSS Feed
- Get Direct Link
- Report Inappropriate Content
Re: How to put censor tick marks in survival curve in JMP?
Dear Jordan,
I have tried your method but I can't seem to build the right survival curve using the graph builder tool.
Do you mind uploading a video tutorial on how you actually made those censor ticks? Cracking my head trying to include those censor ticks in my survival curves though.
Best,
Robinn
- Mark as New
- Bookmark
- Subscribe
- Mute
- Subscribe to RSS Feed
- Get Direct Link
- Report Inappropriate Content
Re: How to put censor tick marks in survival curve in JMP?
Hello,
There is an addin that does this here: https://community.jmp.com/docs/DOC-7472
The censored values are plotted on the x-axis, rather than on the curve itself.
Cheers,
Brady
Recommended Articles
- © 2026 JMP Statistical Discovery LLC. All Rights Reserved.
- Terms of Use
- Privacy Statement
- Contact Us