Turn on suggestions
Auto-suggest helps you quickly narrow down your search results by suggesting possible matches as you type.
- Learn how to build custom Python data connectors and further customize JMP’s Data Connector Framework with the Python Data Connector Demo, available now in the JMP Marketplace!
- See how to create experiments to support product design and ID useful product features. Register for June 12 webinar, 2pm US Eastern Time.
Options
- Subscribe to RSS Feed
- Mark Topic as New
- Mark Topic as Read
- Float this Topic for Current User
- Bookmark
- Subscribe
- Mute
- Printer Friendly Page
Discussions
Solve problems, and share tips and tricks with other JMP users.- JMP User Community
- :
- Discussions
- :
- Re: How do I display Control Chart control limit in "Duration - hr:m" format?

Level I
- Mark as New
- Bookmark
- Subscribe
- Mute
- Subscribe to RSS Feed
- Get Direct Link
- Report Inappropriate Content
How do I display Control Chart control limit in "Duration - hr:m" format?
Feb 1, 2024 08:47 AM
(2509 views)
Hi,
I want to be able to display the control chart limits as a Duration but I can only display as numeric value. The column properties are defined as hr:m and I can display the axis, capability chart, etc. in hr:m but I am not even able to define a Control Limit manually in hr:m format. Does anybody know a work-around?
Thanks,
Chris
2 REPLIES 2

Staff
- Mark as New
- Bookmark
- Subscribe
- Mute
- Subscribe to RSS Feed
- Get Direct Link
- Report Inappropriate Content
Re: How do I display Control Chart control limit in "Duration - hr:m" format?
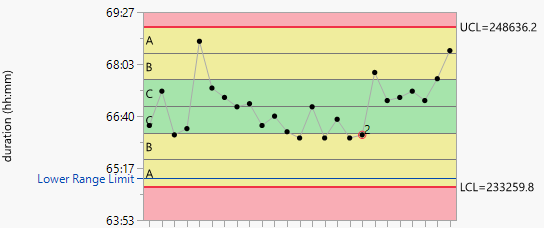
I mocked up some data where the Process variable records time to finish a step. I applied a Duration format to the column. I analyzed Process with Control Chart Builder. It respects the format.

See the attached example.
Level I
- Mark as New
- Bookmark
- Subscribe
- Mute
- Subscribe to RSS Feed
- Get Direct Link
- Report Inappropriate Content
Re: How do I display Control Chart control limit in "Duration - hr:m" format?
Thanks for your reply. I think I must've been using one of the legacy control chart options which seems to have the issue
Recommended Articles
- © 2026 JMP Statistical Discovery LLC. All Rights Reserved.
- Terms of Use
- Privacy Statement
- Contact Us