Turn on suggestions
Auto-suggest helps you quickly narrow down your search results by suggesting possible matches as you type.
Options
- Subscribe to RSS Feed
- Mark Topic as New
- Mark Topic as Read
- Float this Topic for Current User
- Bookmark
- Subscribe
- Mute
- Printer Friendly Page
Discussions
Solve problems, and share tips and tricks with other JMP users.- JMP User Community
- :
- Discussions
- :
- How can I add a second y-axis in graph builder?
- Mark as New
- Bookmark
- Subscribe
- Mute
- Subscribe to RSS Feed
- Get Direct Link
- Report Inappropriate Content
How can I add a second y-axis in graph builder?
Created:
Apr 21, 2022 05:08 PM
| Last Modified: Jun 11, 2023 4:23 AM
(3693 views)
Hi everyone!
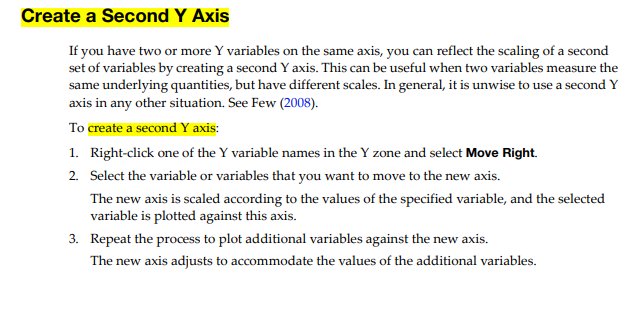
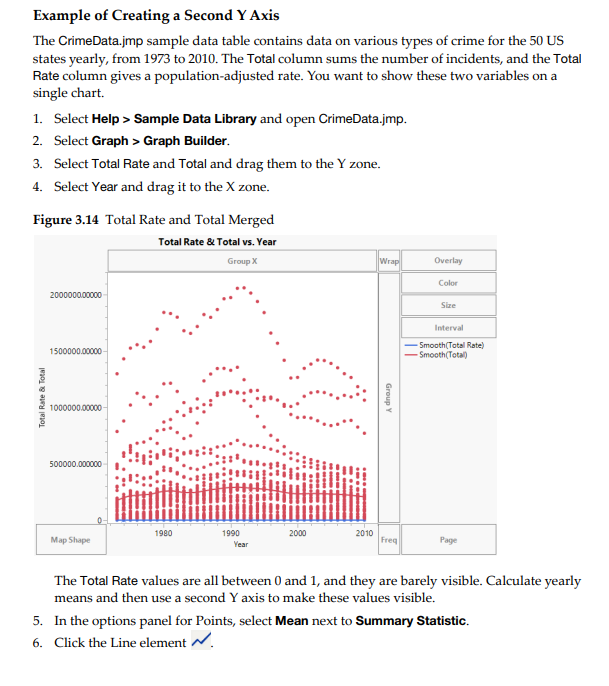
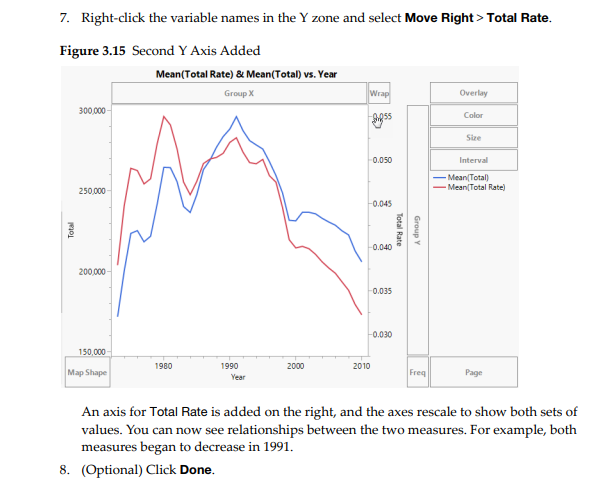
I´m a recently started JMP user, and I´m now preparing some time profile plots using the ¨Line Option¨ in the Graph Builder. I need to show two different variables with independent y-axes and scales in a single plot, but I don´t know how to add the second axis at the right side. I wonder If can get help on how to do that. Thanks in advance,
1 ACCEPTED SOLUTION
Accepted Solutions
- Mark as New
- Bookmark
- Subscribe
- Mute
- Subscribe to RSS Feed
- Get Direct Link
- Report Inappropriate Content
Re: How can I add a second y-axis in graph builder?
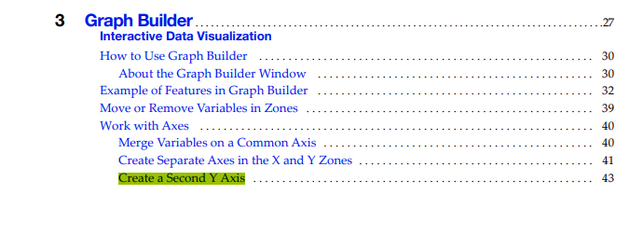
This is very nicely covered in the Essential Graphing document found in the JMP Document Library under the Help pull down menu.
Jim
2 REPLIES 2
- Mark as New
- Bookmark
- Subscribe
- Mute
- Subscribe to RSS Feed
- Get Direct Link
- Report Inappropriate Content
Re: How can I add a second y-axis in graph builder?
This is very nicely covered in the Essential Graphing document found in the JMP Document Library under the Help pull down menu.
Jim
- Mark as New
- Bookmark
- Subscribe
- Mute
- Subscribe to RSS Feed
- Get Direct Link
- Report Inappropriate Content
Re: How can I add a second y-axis in graph builder?
Hi txNelson. Thanks for your help! I appreciate it! Now I was able to add a 2nd y-axis to my graph! :)
Recommended Articles
- © 2026 JMP Statistical Discovery LLC. All Rights Reserved.
- Terms of Use
- Privacy Statement
- Contact Us


