Turn on suggestions
Auto-suggest helps you quickly narrow down your search results by suggesting possible matches as you type.
- New to JMP? Let the Data Analysis Director guide you through selecting an analysis task, an analysis goal, and a data type. Available now in the JMP Marketplace!
- See how to install JMP Marketplace extensions to customize and enhance JMP.
Options
- Subscribe to RSS Feed
- Mark Topic as New
- Mark Topic as Read
- Float this Topic for Current User
- Bookmark
- Subscribe
- Mute
- Printer Friendly Page
Discussions
Solve problems, and share tips and tricks with other JMP users.- JMP User Community
- :
- Discussions
- :
- Re: Help with default view summary statistics
- Mark as New
- Bookmark
- Subscribe
- Mute
- Subscribe to RSS Feed
- Get Direct Link
- Report Inappropriate Content
Help with default view summary statistics
Aug 29, 2024 08:17 PM
(1702 views)
Folks,
I use .jmp 14 for analysis. I am looking for a way to only permanently display only 4 statistics of use to me -Mean, Std.Dev, Mode and Observations. I manually uncheck it each time by clicking on summary. I have also checked under preferences in var chart and unchecked the other non relevant statistics apart from these 4 but it doesn't work. Is that a limitation with. Jmp 14? Any help would greatly be appreciated.
I use .jmp 14 for analysis. I am looking for a way to only permanently display only 4 statistics of use to me -Mean, Std.Dev, Mode and Observations. I manually uncheck it each time by clicking on summary. I have also checked under preferences in var chart and unchecked the other non relevant statistics apart from these 4 but it doesn't work. Is that a limitation with. Jmp 14? Any help would greatly be appreciated.
- Tags:
- windows
3 REPLIES 3
- Mark as New
- Bookmark
- Subscribe
- Mute
- Subscribe to RSS Feed
- Get Direct Link
- Report Inappropriate Content
Re: Help with default view summary statistics
I am not understanding what you are saying. Are you attempting to display data in your data table, or is it from the results from the Distribution platform? Providing an image of what you are referring to would be very helpful.
Jim
- Mark as New
- Bookmark
- Subscribe
- Mute
- Subscribe to RSS Feed
- Get Direct Link
- Report Inappropriate Content
Re: Help with default view summary statistics
Please see this example as you can see entire statistics is displayed by default. I want to only have mean, media, mode and observations displayed.
a
- Mark as New
- Bookmark
- Subscribe
- Mute
- Subscribe to RSS Feed
- Get Direct Link
- Report Inappropriate Content
Re: Help with default view summary statistics
Created:
Aug 30, 2024 02:39 AM
| Last Modified: Aug 29, 2024 11:44 PM
(1641 views)
| Posted in reply to message from BetaPanda273 08-30-2024
Hi @BetaPanda273,
Welcome in the Community !
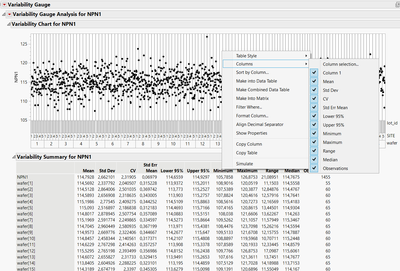
If you right-click on the table of the Variability Summary report and choose "Columns", you can deselect default columns displayed :
In order to always have some columns hidden, you can maybe script the analysis to only make some columns appear. Example here :
Variability Chart(
	Y( :NPN1 ),
	Model( "Main Effect" ),
	X( :wafer, :SITE, :lot_id ),
	Variability Analysis(
		:NPN1,
		Variability Summary Report( 1 ),
		Std Dev Chart( 0 )
	),
	SendToReport(
		Dispatch(
			{"Variability Gauge Analysis for NPN1", "Variability Chart for NPN1",
			"Variability Summary for NPN1"}, "Std Dev", NumberColBox,
			{Visibility( "Collapse" )}
		),
		Dispatch(
			{"Variability Gauge Analysis for NPN1", "Variability Chart for NPN1",
			"Variability Summary for NPN1"}, "CV", NumberColBox,
			{Visibility( "Collapse" )}
		),
		Dispatch(
			{"Variability Gauge Analysis for NPN1", "Variability Chart for NPN1",
			"Variability Summary for NPN1"}, "Std Err Mean", NumberColBox,
			{Visibility( "Collapse" )}
		),
		Dispatch(
			{"Variability Gauge Analysis for NPN1", "Variability Chart for NPN1",
			"Variability Summary for NPN1"}, "Lower 95%", NumberColBox,
			{Visibility( "Collapse" )}
		),
		Dispatch(
			{"Variability Gauge Analysis for NPN1", "Variability Chart for NPN1",
			"Variability Summary for NPN1"}, "Upper 95%", NumberColBox,
			{Visibility( "Collapse" )}
		),
		Dispatch(
			{"Variability Gauge Analysis for NPN1", "Variability Chart for NPN1",
			"Variability Summary for NPN1"}, "Minimum", NumberColBox,
			{Visibility( "Collapse" )}
		),
		Dispatch(
			{"Variability Gauge Analysis for NPN1", "Variability Chart for NPN1",
			"Variability Summary for NPN1"}, "Maximum", NumberColBox,
			{Visibility( "Collapse" )}
		),
		Dispatch(
			{"Variability Gauge Analysis for NPN1", "Variability Chart for NPN1",
			"Variability Summary for NPN1"}, "Range", NumberColBox,
			{Visibility( "Collapse" )}
		)
	)
);
I hope this answer will help you,
Victor GUILLER
"It is not unusual for a well-designed experiment to analyze itself" (Box, Hunter and Hunter)
"It is not unusual for a well-designed experiment to analyze itself" (Box, Hunter and Hunter)
Recommended Articles
- © 2026 JMP Statistical Discovery LLC. All Rights Reserved.
- Terms of Use
- Privacy Statement
- Contact Us


