JMP Security Notice: CVE-2026-109618 and CVE-2026-109619
JMP promptly initiated a review of its products, services, and relevant infrastructure for exposure to CVE-2026-109618 and CVE-2026-109619.
Our assessment of JMP products has not identified exposure to these vulnerabilities. Where remediation was required within supporting environments, appropriate security updates and controls have been applied and validated.
We have identified no evidence of successful exploitation or unauthorized access to JMP systems or customer information associated with these vulnerabilities.
JMP continues to monitor the issue and relevant vendor guidance. No action is required by JMP customers at this time.
- Don’t miss your chance to experience Discovery Summit Europe at our best available rate! Early bird registration through 31 Oct.
- Graph Builder Toolbar streamlines interactive graphing. Creates shortcuts on Report and GraphBuilder Helpers toolbars. Download and install the extension.
- Subscribe to RSS Feed
- Mark Topic as New
- Mark Topic as Read
- Float this Topic for Current User
- Bookmark
- Subscribe
- Mute
- Printer Friendly Page
Discussions
Solve problems, and share tips and tricks with other JMP users.- User Community
- :
- Discussions
- :
- Re: Group multiple column

- Mark as New
- Bookmark
- Subscribe
- Mute
- Subscribe to RSS Feed
- Get Direct Link
- Report Inappropriate Content
Group multiple column
Hi,
I'm novice in JMP. Starting to learn JMP. I'm trying to group a column and count the number of row.
Below is the example to clarify my question. Basically i have 4 unit tested with different pattern. Each pattern will output failure.
How can i group them based on pattern. Any help will be appreciated. Thanks
Example raw data:
| TEST A | TEST A FAIL OUTPUT | TEST B | TEST B FAIL OUTPUT | TEST C | TEST C FAIL OUTPUT | |
| UNIT A | A0 PATTERN | A1 | ||||
| UNIT B | A0 PATTERN | A2 | B0 PATTERN | B1 | C0 PATTERN | C1 |
| UNIT C | A0 PATTERN | A1 | B1 PATTERN | B2 | ||
| UNIT D | B1 PATTERN | B3 | C0 PATTERN | C2 |
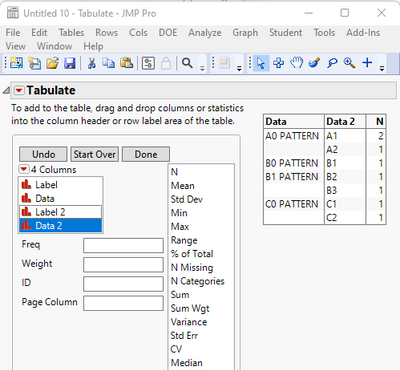
Output needed:
| A0 PATTERN | A1 | 2 |
| A2 | 1 | |
| B0 PATTERN | B1 | 1 |
| B1 PATTERN | B2 | 1 |
| B3 | 1 | |
| C0 PATTERN | C1 | 1 |
| C2 | 1 |
Accepted Solutions


- Mark as New
- Bookmark
- Subscribe
- Mute
- Subscribe to RSS Feed
- Get Direct Link
- Report Inappropriate Content
Re: Group multiple column
The solution is to stack the data and then to use the Tabulate Platform to produce the required output.
Starting with your data table
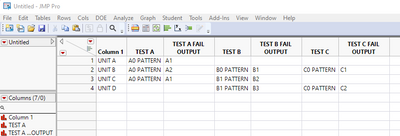
Go to Tables=>Stack
Fill out the Dialog Box as shown
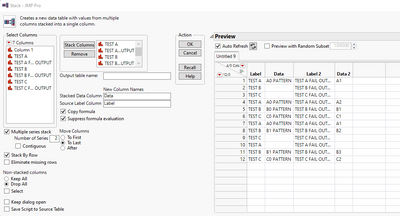
Click on OK and it will give you the table as previewed
Now go to Analyze=>Tabulate
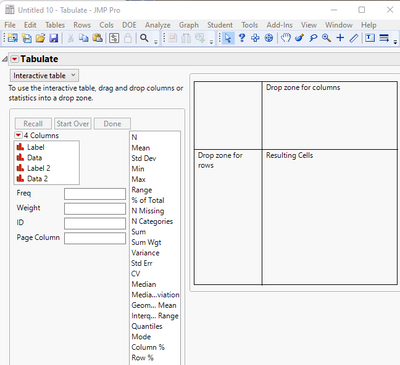
Drag the Data column to the Drop Zone for Rows
Drag the Data 2 to the far edge of the above dragged Data column and you will have the report you want


- Mark as New
- Bookmark
- Subscribe
- Mute
- Subscribe to RSS Feed
- Get Direct Link
- Report Inappropriate Content
Re: Group multiple column
Hello, welcome to JMP.
The table operations are very powerful and will help in this instance. The icons on the Table menu items help describe the actions that reshape data.
There are a number of ways to accomplish your objective, but here is one.
1) Your example data should have column headers before moving to JMP, assume First column is called "Part" in upper left cell
"Copy", "Paste with Column headers" into a blank JMP data table
2) Execute the Table Operation "Stack" (New in JMP 17, the preview window helps with real time feedback of potential output)
- Select all Columns except "Part", press "stack columns" button to select six columns with test information to be stacked
- Check "multiple series stack", set "number of series" to 2
- De-select "Contiguous"
- Check "Eliminate Missing Rows" (optional- it's easy to delete the non-failing test items later)
- Optionally, for non-stacked columns you can "keep all" in case Part/Unit ID will be helpful for other analysis.
- Press Ok
3) On the table generated by the "Stack" operation, execute the Table Operation "Summary"
- Select Columns Data and Data 2, Press "Group" button so both columns are listed in the group box. This will group all combinations of these values. (control-click to select multiple items or do in two steps)
- Uncheck "Link to original data table"
- Press OK
Your requested output
- Mark as New
- Bookmark
- Subscribe
- Mute
- Subscribe to RSS Feed
- Get Direct Link
- Report Inappropriate Content
Re: Group multiple column
The solution is to stack the data and then to use the Tabulate Platform to produce the required output.
Starting with your data table
Go to Tables=>Stack
Fill out the Dialog Box as shown
Click on OK and it will give you the table as previewed
Now go to Analyze=>Tabulate
Drag the Data column to the Drop Zone for Rows
Drag the Data 2 to the far edge of the above dragged Data column and you will have the report you want
- Mark as New
- Bookmark
- Subscribe
- Mute
- Subscribe to RSS Feed
- Get Direct Link
- Report Inappropriate Content
Re: Group multiple column
Hello, welcome to JMP.
The table operations are very powerful and will help in this instance. The icons on the Table menu items help describe the actions that reshape data.
There are a number of ways to accomplish your objective, but here is one.
1) Your example data should have column headers before moving to JMP, assume First column is called "Part" in upper left cell
"Copy", "Paste with Column headers" into a blank JMP data table
2) Execute the Table Operation "Stack" (New in JMP 17, the preview window helps with real time feedback of potential output)
- Select all Columns except "Part", press "stack columns" button to select six columns with test information to be stacked
- Check "multiple series stack", set "number of series" to 2
- De-select "Contiguous"
- Check "Eliminate Missing Rows" (optional- it's easy to delete the non-failing test items later)
- Optionally, for non-stacked columns you can "keep all" in case Part/Unit ID will be helpful for other analysis.
- Press Ok
3) On the table generated by the "Stack" operation, execute the Table Operation "Summary"
- Select Columns Data and Data 2, Press "Group" button so both columns are listed in the group box. This will group all combinations of these values. (control-click to select multiple items or do in two steps)
- Uncheck "Link to original data table"
- Press OK
Your requested output
- Mark as New
- Bookmark
- Subscribe
- Mute
- Subscribe to RSS Feed
- Get Direct Link
- Report Inappropriate Content
Re: Group multiple column
Thanks
I have tried it works on 3 or 4 pattern.
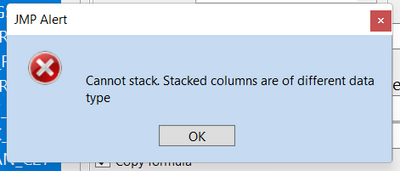
But when i include all my pattern column around 40++ with it output also around 40++. it will pop up this error.
I tried to make all my column to ordinal or nominal but not able to solve this one.
Any idea why it produce such error?
- Mark as New
- Bookmark
- Subscribe
- Mute
- Subscribe to RSS Feed
- Get Direct Link
- Report Inappropriate Content
Re: Group multiple column
If you change all of the columns to character, the stack will then work.
Recommended Articles
- © 2026 JMP Statistical Discovery LLC. All Rights Reserved.
- Terms of Use
- Privacy Statement
- Contact Us