- Don’t miss your chance to experience Discovery Summit Europe at our best available rate! Early bird registration through 31 Oct.
- Graph Builder Toolbar streamlines interactive graphing. Creates shortcuts on Report and GraphBuilder Helpers toolbars. Download and install the extension.
- Subscribe to RSS Feed
- Mark Topic as New
- Mark Topic as Read
- Float this Topic for Current User
- Bookmark
- Subscribe
- Mute
- Printer Friendly Page
Discussions
Solve problems, and share tips and tricks with other JMP users.- User Community
- :
- Discussions
- :
- Re: Graphs repeated measures ANOVA

- Mark as New
- Bookmark
- Subscribe
- Mute
- Subscribe to RSS Feed
- Get Direct Link
- Report Inappropriate Content
Graphs repeated measures ANOVA
Hi, I am doing a repeated measures analysis and while making the graphs for one of the variables got stuck. So this graph has a group variable on the X axis(nominal) and the Y axis has 4 values of DNA (continuous) at 4 different time points. I got the graph neat and nice but the x axis shows values for both groups separately while I want them side by side. e.g. day 0 DNA both groups together, Day 4 DNA both groups together (side by side) but apparantly have tried everything but can't figure out how to do it.


- Mark as New
- Bookmark
- Subscribe
- Mute
- Subscribe to RSS Feed
- Get Direct Link
- Report Inappropriate Content
Re: Graphs repeated measures ANOVA
which graph platform are you using?
also, plotting the data as an ANOVA, the both variables on the x-axis must be nominal.


- Mark as New
- Bookmark
- Subscribe
- Mute
- Subscribe to RSS Feed
- Get Direct Link
- Report Inappropriate Content
Re: Graphs repeated measures ANOVA
I am making a guess, but I think you are trying to graph your results using Graph Builder. If so, the only way that I know of to get the result you need is to add a second X column into your data table, which shows the second group of X values. Graph Builder will only provide separate axes if there are separate columns.
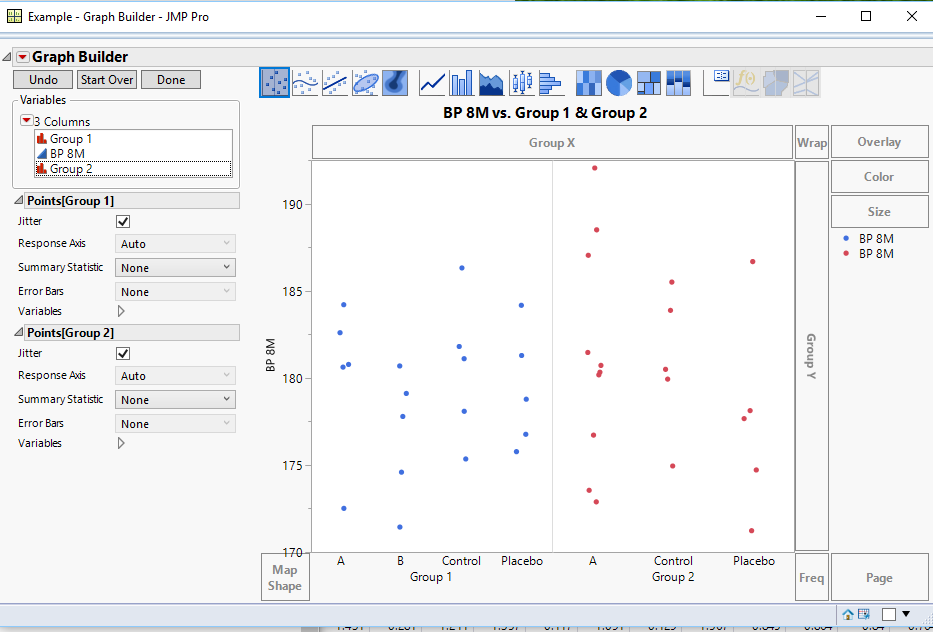
In the example, drag the Y axis to the Y drop area, and then drag the 2 X axis variables one at a time to the X axis drop area, placing them side by side. Below is the script that produces the above graph
Names Default To Here( 1 );

// Sample Data
dt = New Table( "Example",
	Add Rows( 40 ),
	New Column( "Group 1",
		Character( 7 ),
		"Nominal",
		Set Values(
			{"A", "A", "A", "A", "A", "B", "B", "B", "B", "B", "Control", "Control", "Control",
			"Control", "Control", "Placebo", "Placebo", "Placebo", "Placebo", "Placebo", "", "",
			"", "", "", "", "", "", "", "", "", "", "", "", "", "", "", "", "", ""}
		)
	),
	New Column( "BP 8M",
		Numeric,
		"Continuous",
		Format( "Fixed Dec", 4, 0 ),
		Set Values(
			[182.595915155309, 172.512940709438, 180.774421425438, 180.620679187184,
			184.202187190097, 171.439595422176, 174.589230394192, 179.109260746268,
			177.787439187438, 180.687489407623, 181.804016028632, 178.085353285743,
			186.313144806757, 175.347853139956, 181.103289178403, 181.288352739913,
			178.777832744608, 176.763152449944, 175.768608854708, 184.167672392284,
			173.550216520736, 180.718560564297, 188.500473854652, 176.718084823659,
			180.174755903154, 181.462075626649, 180.330100756984, 172.886222586229,
			192.050244302843, 187.037431530346, 185.501158177984, 183.877324525276,
			179.931613365546, 180.493132509235, 174.944992509985, 177.663853371957,
			174.717037207769, 186.677919707096, 178.12326354079, 171.230704316198]
		)
	),
	New Column( "Group 2",
		Character,
		"Nominal",
		Set Values(
			{"", "", "", "", "", "", "", "", "", "", "", "", "", "", "", "", "", "", "", "", "A",
			"A", "A", "A", "A", "A", "A", "A", "A", "A", "Control", "Control", "Control",
			"Control", "Control", "Placebo", "Placebo", "Placebo", "Placebo", "Placebo"}
		)
	)
);

// Graph Script
Graph Builder(
	Variables( X( :Group 1 ), X( :Group 2 ), Y( :BP 8M ) ),
	Elements( Position( 1, 1 ), Points( X, Y, Legend( 4 ) ) ),
	Elements( Position( 2, 1 ), Points( X, Y, Legend( 5 ) ) )
);Recommended Articles
- © 2026 JMP Statistical Discovery LLC. All Rights Reserved.
- Terms of Use
- Privacy Statement
- Contact Us