Turn on suggestions
Auto-suggest helps you quickly narrow down your search results by suggesting possible matches as you type.
- Don’t miss your chance to experience Discovery Summit Europe at our best available rate! Early bird registration through 31 Oct.
- Graph Builder Toolbar streamlines interactive graphing. Creates shortcuts on Report and GraphBuilder Helpers toolbars. Download and install the extension.
Options
- Subscribe to RSS Feed
- Mark Topic as New
- Mark Topic as Read
- Float this Topic for Current User
- Bookmark
- Subscribe
- Mute
- Printer Friendly Page
Discussions
Solve problems, and share tips and tricks with other JMP users.- User Community
- :
- Discussions
- :
- Re: Graphique

Level VI
- Mark as New
- Bookmark
- Subscribe
- Mute
- Subscribe to RSS Feed
- Get Direct Link
- Report Inappropriate Content
Graphique
Created:
Jul 12, 2023 04:19 AM
| Last Modified: Jul 12, 2023 1:20 AM
(2090 views)
Bonjour à tous,
Je dispose d’un graphique dans lequel je compare les performances de différents objets.
J’aimerai pouvoir rajouter la moyenne des performances de tous les objets sur le graphique.
Exemple ci-dessous :
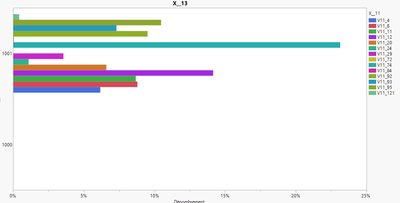
Deux options seraient possibles :
1 - Rajouter une barre verticale avec pour abscisse le pourcentage des moyennes de tous les objets
2 - Rajouter une barre horizontale avec pour longueur le pourcentage des moyennes de tous les objets
Merci pour vos réponses !
3 REPLIES 3


Super User
- Mark as New
- Bookmark
- Subscribe
- Mute
- Subscribe to RSS Feed
- Get Direct Link
- Report Inappropriate Content
Re: Graphique
Hi,
Here is one possible solution to your question.
- You need to specify your V11xxx categories as OVERLAY to produce the graph you shared
- Right-click on the plot area and ADD a new BAR plot
- On the left of the Graph Builder window, locate the new BAR options, click on the red downward triangle, and unselect the OVERLAY for that set of bars only
- Change the BAR STYLE to FLOAT
Feel free to share your data table or a mock example data table to enable the creation of a script I could build for you.
Best,
TS
Thierry R. Sornasse
Level VI
- Mark as New
- Bookmark
- Subscribe
- Mute
- Subscribe to RSS Feed
- Get Direct Link
- Report Inappropriate Content
Re: Graphique
Merci pour votre réponse, malgré les opérations que vous avez indiqué je n’ai pas réussi à obtenir le bon résultat.
Je laisse la base de données en pièce-jointe pour que vous puissiez travailler dessus.
Le script est disponible dans la base de données, juste il manque la moyenne comme je l’ai décris ci-dessus.
Cordialement.
Super User
- Mark as New
- Bookmark
- Subscribe
- Mute
- Subscribe to RSS Feed
- Get Direct Link
- Report Inappropriate Content
Re: Graphique
Hi,
Sorry for misunderstanding the issue. My approach will not work with the COUNT x-axis (i.e., Total, %Total, %Grand Total).
You may need to generate an intermediate table using the SUMMARIZE function.
Best,
TS
Thierry R. Sornasse
Recommended Articles
- © 2026 JMP Statistical Discovery LLC. All Rights Reserved.
- Terms of Use
- Privacy Statement
- Contact Us