Turn on suggestions
Auto-suggest helps you quickly narrow down your search results by suggesting possible matches as you type.
- New to JMP? Join us Sept. 23-24 for the Early User Edition of Discovery Summit, tailor-made for new users. Register now for free!
- Learn some foundational elements of JMP Scripting Language (JSL) and how to extend point & click automation into repeatable, shareable routines. Register. June 26, 2 p.m. US Eastern Time.
Options
- Subscribe to RSS Feed
- Mark Topic as New
- Mark Topic as Read
- Float this Topic for Current User
- Bookmark
- Subscribe
- Mute
- Printer Friendly Page
Discussions
Solve problems, and share tips and tricks with other JMP users.- JMP User Community
- :
- Discussions
- :
- Graphbuilder - not all of the labels are displaying

Level IV
- Mark as New
- Bookmark
- Subscribe
- Mute
- Subscribe to RSS Feed
- Get Direct Link
- Report Inappropriate Content
Graphbuilder - not all of the labels are displaying
Aug 17, 2019 07:59 AM
(7189 views)
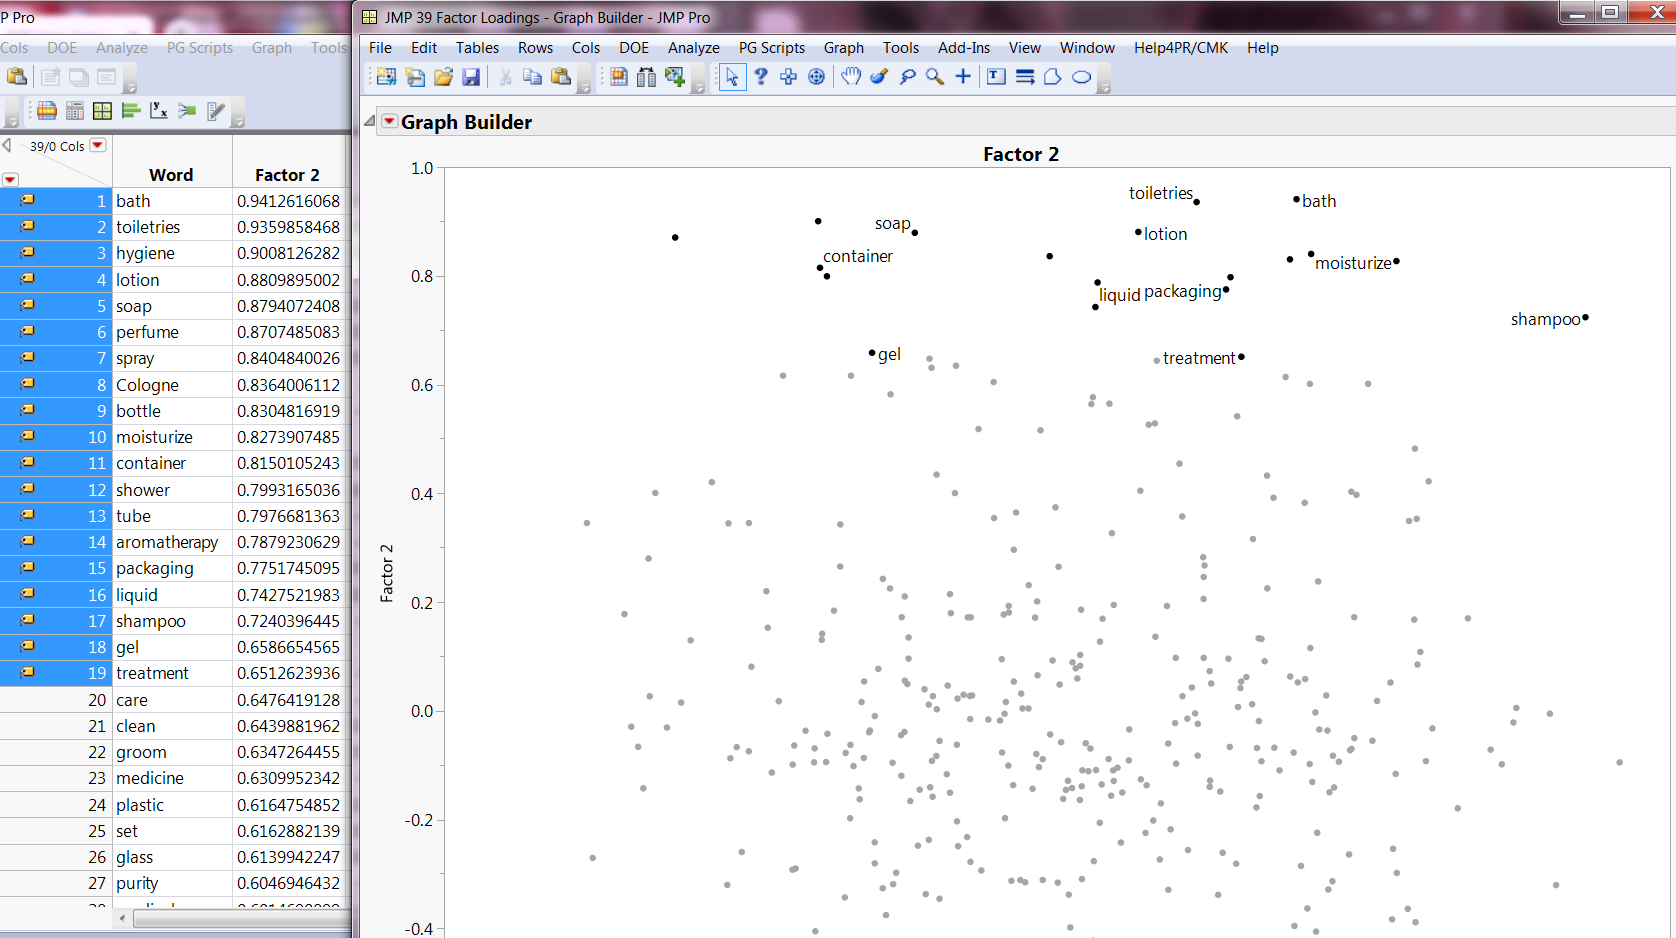
I want to build a chart that shows the labels for all of the points that have a high y value (interactive). I selected the top 20 points and set label for those rows. Not all of the labels display in the built chart. Is there a way to have the software put all of the labels in even if they are overlaping? I changed the jitter so that the points are more spread out, but the labels still don't apprear. In the image I'm showing the data and the chart. The selected points in the chart are the ones where I have added the label.
1 ACCEPTED SOLUTION
Accepted Solutions

Super User
Solution
- Mark as New
- Bookmark
- Subscribe
- Mute
- Subscribe to RSS Feed
- Get Direct Link
- Report Inappropriate Content
Re: Graphbuilder - not all of the labels are displaying
3 REPLIES 3
Super User
Solution
- Mark as New
- Bookmark
- Subscribe
- Mute
- Subscribe to RSS Feed
- Get Direct Link
- Report Inappropriate Content
Re: Graphbuilder - not all of the labels are displaying
this option, I think.

Craige
Level IV
- Mark as New
- Bookmark
- Subscribe
- Mute
- Subscribe to RSS Feed
- Get Direct Link
- Report Inappropriate Content
Re: Graphbuilder - not all of the labels are displaying
Thanks, Craige. That did the trick!

Level I
- Mark as New
- Bookmark
- Subscribe
- Mute
- Subscribe to RSS Feed
- Get Direct Link
- Report Inappropriate Content
Re: Graphbuilder - not all of the labels are displaying
This solution is not working in JMP 17 on Windows 11
Recommended Articles
- © 2026 JMP Statistical Discovery LLC. All Rights Reserved.
- Terms of Use
- Privacy Statement
- Contact Us