- Don’t miss your chance to experience Discovery Summit Europe at our best available rate! Early bird registration through 31 Oct.
- Graph Builder Toolbar streamlines interactive graphing. Creates shortcuts on Report and GraphBuilder Helpers toolbars. Download and install the extension.
- JMP will suspend normal business operations for our Rest and Recharge Day on Friday, October 2, 2026.
Regular business hours will resume on Monday, October 5, 2026.
- Subscribe to RSS Feed
- Mark Topic as New
- Mark Topic as Read
- Float this Topic for Current User
- Bookmark
- Subscribe
- Mute
- Printer Friendly Page
Discussions
Solve problems, and share tips and tricks with other JMP users.- User Community
- :
- Discussions
- :
- Graph Builder bug? multiple response and boxplots

- Mark as New
- Bookmark
- Subscribe
- Mute
- Subscribe to RSS Feed
- Get Direct Link
- Report Inappropriate Content
Graph Builder bug? multiple response and boxplots
I just noticed that Graph Builder/BoxPlot has some problems with columns of modeling type Multiple Response.
this gets apparent if non-multiple-response entries are used.
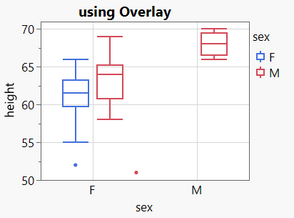
In plot 1, a male subset is showing up in the female group on the left.
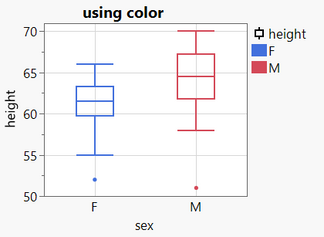
This is not the case if color is used instead of Overlay (second plot).
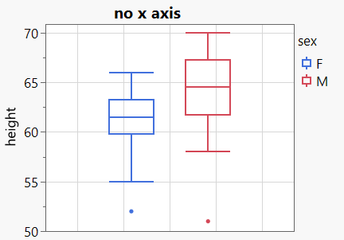
The wrong female plot looks like the 3rd plot - where on the x axis no distinction is made between male and female.
Same issue if X and Y axis are interchanged.
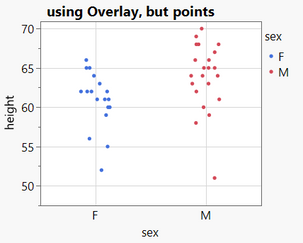
Point plots are fine.
Plots via Group X or Group Y are fine.
Names Default to Here(1);
dt = Open( "$SAMPLE_DATA/Big Class.jmp" );

dt:sex << Set Modeling Type( "Multiple Response" );

Graph Builder(
	Show Control Panel( 0 ),
	Variables( X( :sex ), Y( :height ), Overlay( :sex ) ),
	Elements( Box Plot( X, Y, Legend( 5 ) ) )
);

Graph Builder(
	Show Control Panel( 0 ),
	Variables( X( :sex ), Y( :height ), Color( :sex ) ),
	Elements( Box Plot( X, Y, Legend( 5 ) ) )
);

Graph Builder(
	Show Control Panel( 0 ),
	Variables( Y( :height ), Overlay( :sex ) ),
	Elements( Box Plot( Y, Legend( 5 ) ) )
);

Graph Builder(
	Show Control Panel( 0 ),
	Variables( X( :sex ), Y( :height ), Overlay( :sex ) ),
	Elements( Points( X, Y, Legend( 6 ) ) ),
);
Accepted Solutions


- Mark as New
- Bookmark
- Subscribe
- Mute
- Subscribe to RSS Feed
- Get Direct Link
- Report Inappropriate Content
Re: Graph Builder bug? multiple response and boxplots
.Yes, looks like a bug in the combination of box plot + MR x + MR overlay. Thanks for the nice example.


- Mark as New
- Bookmark
- Subscribe
- Mute
- Subscribe to RSS Feed
- Get Direct Link
- Report Inappropriate Content
Re: Graph Builder bug? multiple response and boxplots
Just curious...if you think you found a bug, you should report this to [email protected] I'm not sure why you report it here on the forum. Unless you want us to confirm what you are finding, then it would be useful to attach the JMP table you are using.
- Mark as New
- Bookmark
- Subscribe
- Mute
- Subscribe to RSS Feed
- Get Direct Link
- Report Inappropriate Content
Re: Graph Builder bug? multiple response and boxplots
hi @statman
yes, you are right, it's still a question :)
Actually, I cannot imagine what could be wrong with the code.
But sometimes, it's a small comma or point.
Sure:
If somebody confirms that this behavior is not like expected, I will send a link to this post to [email protected].
Thank you for the comment about the data table.
At first I didn't get the actual "message" - it was quite implicitly.
Direct answer to the question: the data table is from the sample directory - so everybody should have the file on his computer.
But you are right - no issues with this file :)
--> when posting the script, I missed the line with the modeling type conversion.
I just added it now. So, you should be able now to reproduce the described behavior with the file from your sample directory.
- Mark as New
- Bookmark
- Subscribe
- Mute
- Subscribe to RSS Feed
- Get Direct Link
- Report Inappropriate Content
Re: Graph Builder bug? multiple response and boxplots
.Yes, looks like a bug in the combination of box plot + MR x + MR overlay. Thanks for the nice example.
- Mark as New
- Bookmark
- Subscribe
- Mute
- Subscribe to RSS Feed
- Get Direct Link
- Report Inappropriate Content
Re: Graph Builder bug? multiple response and boxplots
submitted to Jmp Support: Case Number TS-00034079
Recommended Articles
- © 2026 JMP Statistical Discovery LLC. All Rights Reserved.
- Terms of Use
- Privacy Statement
- Contact Us