- Don’t miss your chance to experience Discovery Summit Europe at our best available rate! Early bird registration through 31 Oct.
- Graph Builder Toolbar streamlines interactive graphing. Creates shortcuts on Report and GraphBuilder Helpers toolbars. Download and install the extension.
- Subscribe to RSS Feed
- Mark Topic as New
- Mark Topic as Read
- Float this Topic for Current User
- Bookmark
- Subscribe
- Mute
- Printer Friendly Page
Discussions
Solve problems, and share tips and tricks with other JMP users.- User Community
- :
- Discussions
- :
- Re: Graph Builder: Ticks in Heatmap at center of cells

- Mark as New
- Bookmark
- Subscribe
- Mute
- Subscribe to RSS Feed
- Get Direct Link
- Report Inappropriate Content
Graph Builder: Ticks in Heatmap at center of cells
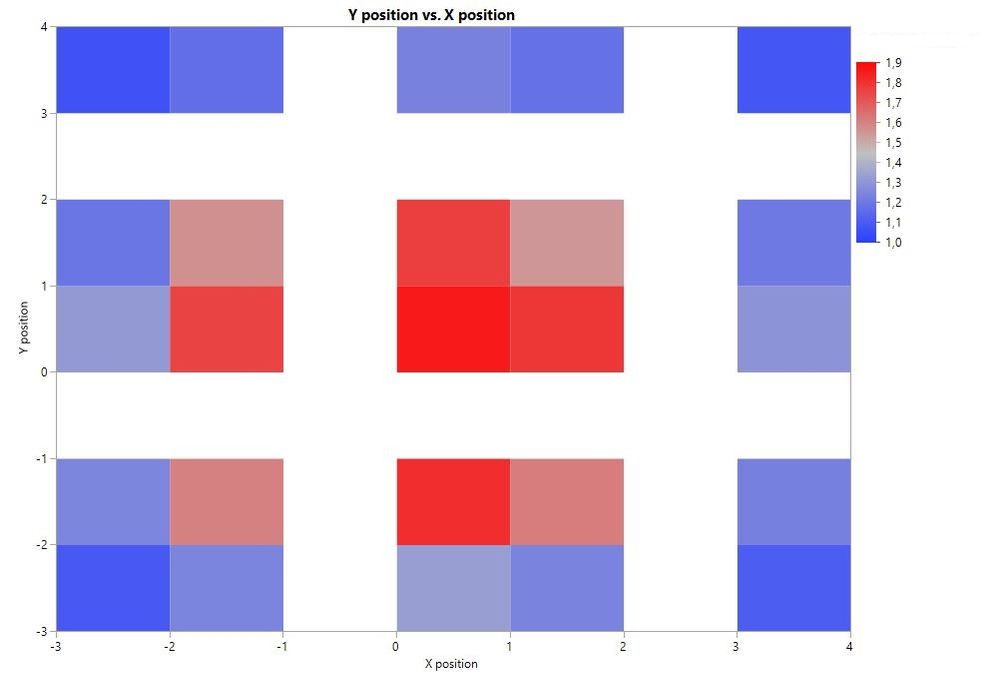
I want to put the ticks in a heatmap at the center of the cells and not on the grid, which doesn't make sense in my case. I think you'll know what I mean when looking at the graph. The white spaces are incorrect as we measured in x and y at 0, 1.5 and 3
Is there an option somewhere to change the position of the ticks?
Thanks
Accepted Solutions


 Community Manager
- Mark as New
- Bookmark
- Subscribe
- Mute
- Subscribe to RSS Feed
- Get Direct Link
- Report Inappropriate Content
Re: Graph Builder: Ticks in Heatmap at center of cells
Hi @JL_LZH,
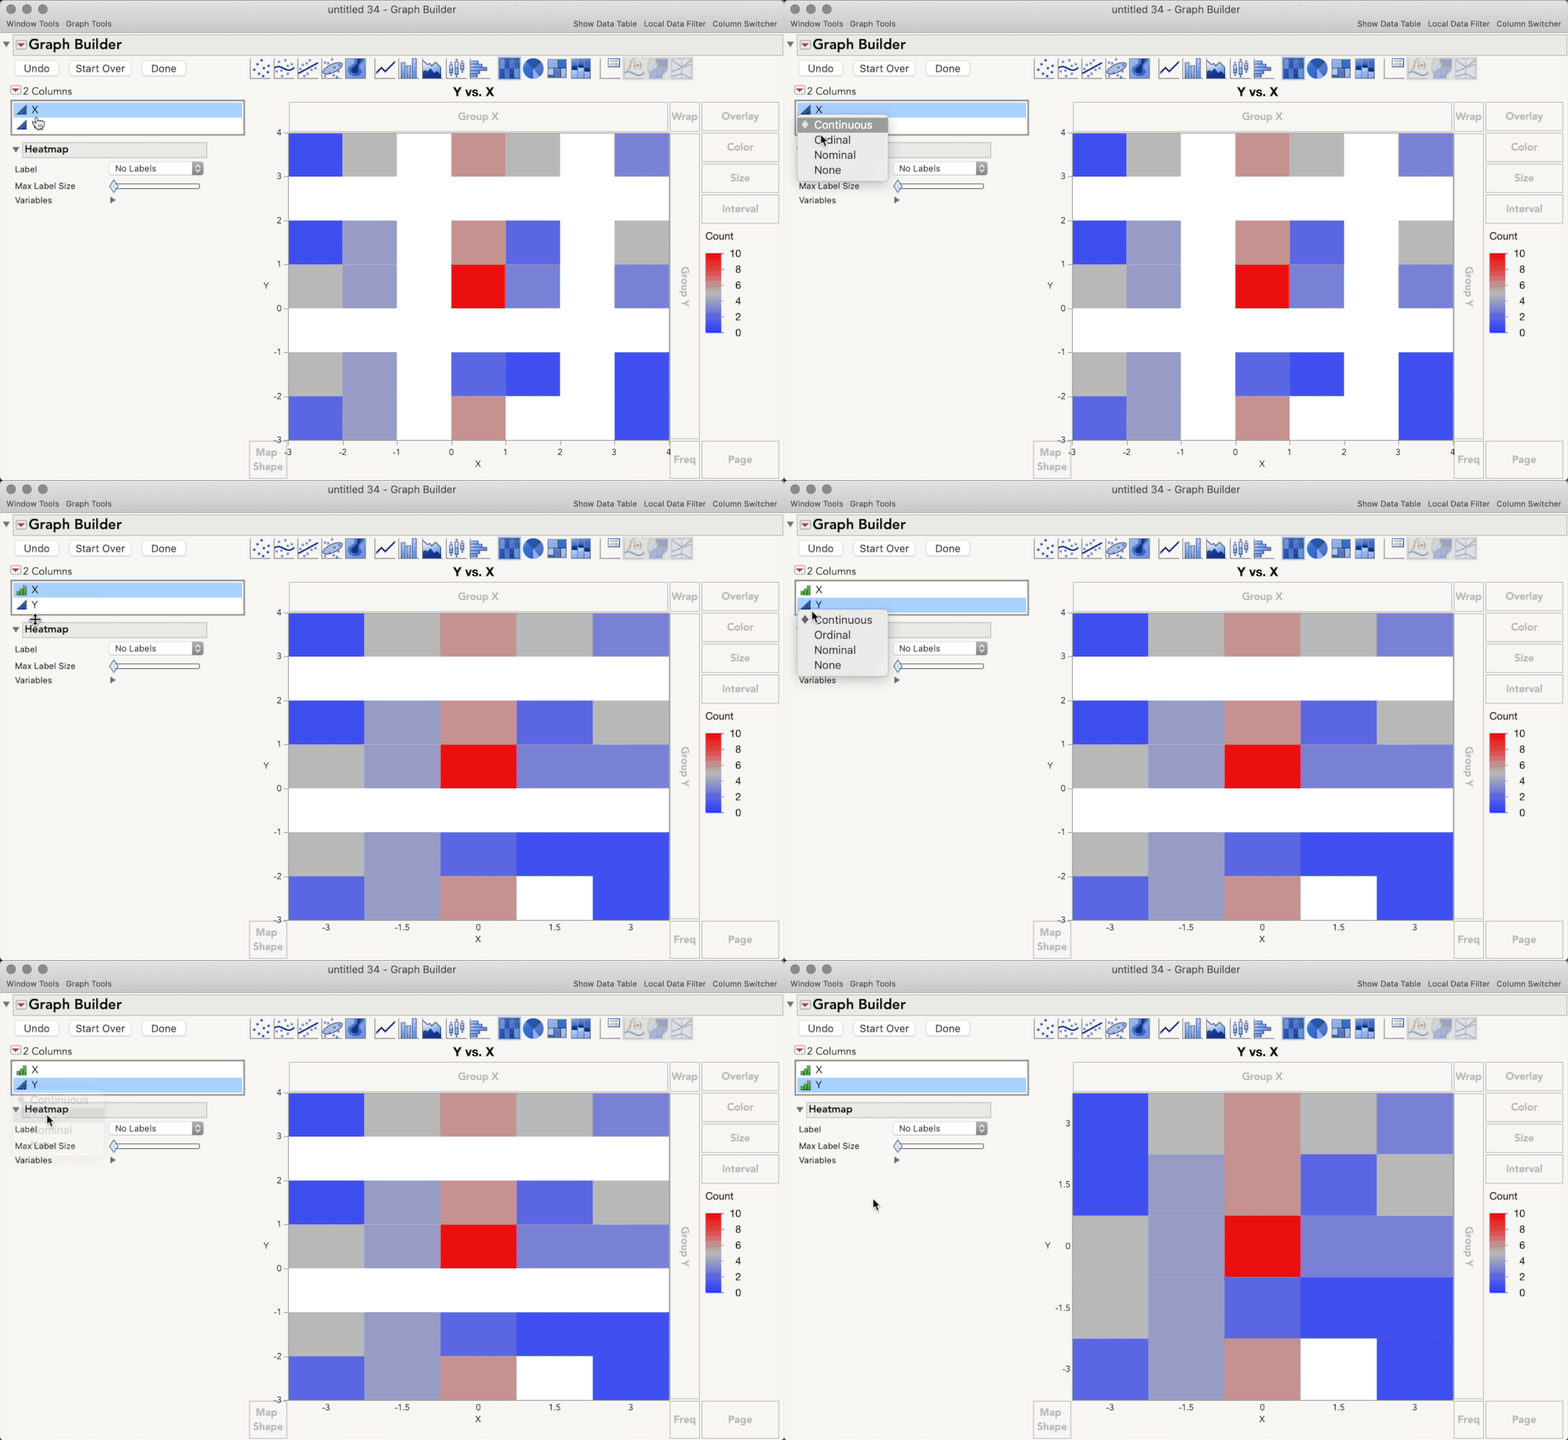
I see what you mean -- because JMP is treating your columns as continuous measurements the binning of observations at increments of 1 results in a pretty strange looking plot. You cannot change the location of the tick marks for a continuous scale, but I think an easy solution will be to change the modeling types of your variables to Ordinal by right-clicking the modeling type and selecting Ordinal, as in the animated gif below.
Does that help get you closer to what you want for this plot?
Community Manager
- Mark as New
- Bookmark
- Subscribe
- Mute
- Subscribe to RSS Feed
- Get Direct Link
- Report Inappropriate Content
Re: Graph Builder: Ticks in Heatmap at center of cells
Hi @JL_LZH,
I see what you mean -- because JMP is treating your columns as continuous measurements the binning of observations at increments of 1 results in a pretty strange looking plot. You cannot change the location of the tick marks for a continuous scale, but I think an easy solution will be to change the modeling types of your variables to Ordinal by right-clicking the modeling type and selecting Ordinal, as in the animated gif below.
Does that help get you closer to what you want for this plot?
- Mark as New
- Bookmark
- Subscribe
- Mute
- Subscribe to RSS Feed
- Get Direct Link
- Report Inappropriate Content
Re: Graph Builder: Ticks in Heatmap at center of cells
perfect answer, works exactly as I want.
Recommended Articles
- © 2026 JMP Statistical Discovery LLC. All Rights Reserved.
- Terms of Use
- Privacy Statement
- Contact Us